|
|
As the relationship between IT and data consumers continues to evolve, self-service analytics development has emerged as an attractive alternative to projects driven by IT. Data consumers believe they can execute their own development faster and with better understanding of the underlying data. According to Donna Burbank, a data governance expert and managing director at Global Data Strategy, “The days of businesses sending requests over the fence to IT and waiting weeks for a reply are over. The new way of working fosters a more collaborative approach, where not only is turnaround faster but where business users have a more active role in the analysis and creation of reporting and analytics” (interviewed by the author, January 25, 2016).
The number of commercial tools aimed at non-IT users has exploded in the past few years, and the infrastructure to support these efforts can be deployed in the cloud by consumers without the assistance of IT. Although power users have been doing self-service in Excel for years, longer and more expensive IT cycles combined with technically savvy data consumers make self-service a much more attractive proposition.
Self-Service Analytics Defined
Self-service analytics includes reporting and dashboards created outside of IT that in many cases require the introduction of new, “noncurated” data sets. These insights may be developed within a reporting tool, in Excel, or through direct SQL. In addition, they may utilize advanced statistical modeling techniques to predict outcomes.
Self-service introduces a major challenge in terms of governance. Organizations have spent years dealing with isolated information silos, and consumer-driven analytics development creates additional opportunities for duplication and technical debt. It is important to recognize the varying degrees of self-service and remain mindful that governance becomes more problematic whenever the consumer is manipulating and preparing data. This can happen explicitly through a wrangling tool (such as Alteryx) or it may happen in more subtle ways, such as through nested SQL transformations in the reporting layer.
Self-service always seems like a great idea in the beginning. Business consumers and stakeholders have more control; they can pick their own resources; and because they know their data better than anyone in IT, they don’t have to explain their requirements to someone else. The software industry has enabled this by developing user-friendly tools that help with the extraction, movement, and preparation of data sets (e.g., Alteryx and Lavastorm). Vendors have also developed tools that allow end users to prepare professional dashboards and visualizations quickly and easily (e.g., Tableau and Qlik).
Issues arise later when the reporting solution becomes difficult to maintain. Scalability problems crop up and suddenly it takes too long to generate the results, or long-running queries start to impact the performance of other processes. These problems may drive the business to build a brand-new report from scratch, starting the cycle all over again.
Best Practices for Governing Self-Service Effectively
IT organizations need to develop partnerships with their business consumers and help them build trusted solutions nimbly. This entails delivering accurate results in a reasonable amount of time. Here are some ways to be agile without sacrificing quality:
- Foster collaboraton. IT has to act in a consulting capacity and resist the desire to play the gatekeeper role. The focus should be on helping the business improve the longevity and scalability of its solutions. It might be as simple as providing assistance with query optimization or, in some cases, embedding analysts and architects in the development process. The days when IT says, “We don’t support that,” are long past. Instead, IT should affirm, “We will help you deploy a better solution that will be more scalable [i.e., cost-effective or secure].”
- Secure executive sponsorship for governance. Data governance at all levels needs to enforce best practices that promote reusable design patterns, sustainable solutions, and scalability. Executives need to support data governance at a strategic level. IT should facilitate data governance and support business stakeholders in navigating governance policies. Directors and executives need to help prioritize analytics initiatives across shared resources and set reasonable expectations with stakeholders.
- Promote models of success. Successful partnerships should be promoted as models for success throughout the organization.
- Use flexible development methodologies with well-defined roles and expectations. IT teams should adopt a “get it done” attitude when approaching development but must also clearly define roles and responsibilities up front. Sensitivity to the modes of development that the business employs—especially those related to gathering requirements and user stories—is important, but everyone ought to understand who does what and when it will get done.
Brad Ewald is a solutions architect for Children’s Hospital Colorado. He has been developing data and BI solutions for 20 years and has experience in financial services, marketing, and healthcare.
TDWI Onsite Education: Let TDWI Onsite Education partner with you on your analytics journey. TDWI Onsite helps you develop the skills to build the right foundation with the essentials that are fundamental to BI success. We bring the training directly to you—our instructors travel to your location and train your team. Explore the listing of TDWI Onsite courses and start building your foundation today.
|
|
Premium Member Discounts
Ready to take the CBIP Exams or attend our next conference? Take advantage of these exclusive member discounts.
| $275
Discount
on TDWI Accelerate |
$26
Discount
on CBIP Exam Guide |
|
We gather data—lots of it. We become intimately aware of just how much detail can or cannot be absorbed at a glance or displayed in our reporting tools. We want less information but need complete information. How else can important business decisions be made?
So we aggregate—and then we aggregate some more. Sometimes we even aggregate our aggregations, which itself can lead to numeric deception in values. Whether they are baked into the recurring build of sales and marketing’s favorite OLAP cube, within a modern visualization tool that offers data management, or a materialized summary table created to link from accounting’s Excel spreadsheet via a custom database procedure written in SQL, an aggregate function is an algorithmic construct that delivers a single value across a given subset of records (defined by the chosen groupings).
Because of this the aggregate is, in every sense of the phrase, “information lossy.” It throws detail overboard and makes the best attempt at producing a single set attribute that we can better digest. We accept it as rock-solid truth, but the algorithms do make compromises.
The output of that mathematical construct is generally accepted to be correct with given inputs, but it does not always tell the whole story. In this article, we will revisit the common aggregate functions in a new light, explore two categories of “information deception” that arise, and discuss how they are distinctly different.
Moreover, we will look at how the aggregate functions, over some grouping, can be thought of as existing orthogonally to a longitudinally changing state of an entity instance such as “customer” or “product.” We will then look at simple things we can do to increase confidence in the aggregate values that are essential for business reporting.
Learn more: Read the entire article by downloading the Business Intelligence Journal (Vol. 21, No. 1). |
| |
 |
 |
|
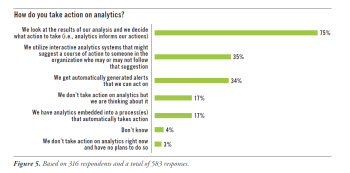
Taking action needs to be the cornerstone for embedded and operationalizing analytics. What good is it to make analytics part of a business process if you don’t act on it? There are different ways organizations can take action on analytics. Taking action can range from manually taking action as part of a process to embedding the analytics into a process that automatically acts.
The vast majority of use cases involve manually taking action. As part of the survey, we asked respondents how they take action on analytics. They could select as many ways as applied. By far, the largest percentage of respondents stated that analytics informs action (see Figure 5). In other words, respondents look at the results of an analysis and decide what action to take. Seventy-five percent of respondents included this in their answers.
Of course, this might run from the simple to the complex. An executive might look at a dashboard that reveals that sales are down in the Northeast for a specific product. The executive may make a decision based on that fact. A predictive model might suggest that marketing should offer a certain price promotion to a specific group of people and marketing makes that offer.
There are other ways organizations are taking action. For instance, 34% of respondents mentioned that they might get automatically generated alerts they can act on. These might be alerts for fraud, alerts for a drop in sales, or more. The organization received the alert and then acts on it. Thirty-five percent of respondents stated that they might utilize interactive analytics systems that suggest a course of action to someone in the organization who may or may not follow that action. For instance, a call center representative may get an alert, based on a predictive model, that the representative should try to up-sell a customer on another product during the course of the conversation. The representative may or may not do so.
A much smaller percentage are automating analytics. Fewer than 20% of respondents have embedded analytics into a process in their organization that automatically takes action. This might be a recommendation engine on an e-commerce website; it might be a preventive maintenance application that automatically shuts down a piece of equipment on an oil rig. The list goes on. Members of this small group are moving past embedding analytics into dashboards to embedding them into operational systems (69% currently do this now, not shown), databases (62% doing this now, not shown), and applications and operational reports. The majority of these respondents are using these analytics in operations (63%, not shown) as well as in customer service and support (58%, not shown). In many cases their main driver is automating analysis that is too complex for people to perform. It can often involve making small automated decisions over and over again. This is the future of operationalizing analytics, more commonly referred to as the discipline of enterprise decision management.
Some respondents still don’t act on analytics. Of course, there are always organizations that still don’t take action on analytics. In this group of respondents, close to 20% are currently not taking action on their data.
(Click for larger image)
Read the full report: Download TDWI Best Practices Report: Operationalizing and Embedding Analytics for Action (Q1 2016).
|
| |
 |
|
|
What sense does it make to collect huge volumes of disparate IoT data if you do nothing with it? In fact, some experts believe that simply collecting data is a liability. Analytics helps organizations gain insight and value from the data and to act on it. Your organization must recognize that the primary path to getting business value from IoT data is through analytics.
There are different kinds of analytics you can use with IoT data. These include alerts, continuous queries, models, and predictive models run against the data. For instance, a person with a medical device, such as a heart monitor implant that continuously monitors the patient’s health, can alert care providers in case of an emergency. Other examples include an automobile with built-in sensors that send an alert to the owner’s mobile phone when tire pressure is low, and a part in a manufacturing plant that can send a real-time alert when a piece of equipment fails. This is the break-fix model, but more often organizations are looking to do projects that might involve preventive maintenance. This involves using historical data that captures what happens before a part breaks, and this model is then instantiated back into the process.
Analytics can be performed at different points in the IoT initiative, from edge analytics that occur at the sensor level to those that occur in a data center. Edge analytics, for instance, has arisen from the need to make decisions at the sensor level device rather than transmit data back to the cloud where processing might delay critical decisions. Therefore, your strategy needs to understand the value of analytics and include a value statement in your initial business case and plan.
Read the full issue: Download Ten Mistakes to Avoid in Preparing for IoT Analytics (Q1 2016).
|
| |
 |
|
|
|
|