
 View online: tdwi.org/flashpoint


March 3, 2016
ANNOUNCEMENTS
NEW TDWI Infographic
Operationalizing and Embedding Analytics for Action
NEW Best Practices Report
Operationalizing and Embedding Analytics for Action
NEW Ten Mistakes to Avoid
When Deploying Visual BI and Analytics for Business Decisions
NEW Business Intelligence Journal
Business Intelligence Journal,
Vol. 20, No. 4
NEW Checklist Report
Seven Best Practices for Adopting Data Warehouse Automation
NEW Checklist Report
Seven Steps to Faster Analytics Processing with Open Source: Realizing Business Value from the Hadoop Ecosystem
CONTENTS


Mistake: Turning a Blind Eye to the Potential of In-Memory and Cloud Computing

See what's
current in TDWI Education, Events, Webinars,
and Marketplace
Why SQL?
Gordon S. Linoff
Founder, Data Miners, Inc.
Once upon a time, the stable, scalable, reliable way to store data was to use a relational database. In such a world, learning SQL—the lingua franca of the relational database world—was essentially a no-brainer. Time has passed. Data has multiplied profusely, along with a multitude of different formats, sources, acronyms, and cryptic names.
Today, relational databases are one stable, scalable, reliable way of storing data. The ACID properties of databases (atomicity, consistency, isolation, and durability) that ensure data integrity can be relaxed for many applications. Handling hundreds or thousands of transactions per second is nice, but some applications require tens or hundreds of thousands of transactions. Relational databases have their place, as do newer technologies that offer enhanced functionality in some important areas.
Analysts and other power users who spend much of their time and effort working with data can appreciate one definition of data mining: data mining is torturing data until it confesses—something that comes naturally to users of SQL. Even some rather sophisticated data mining and statistical models—such as survival models, association rules, look-alike models, and naive Bayesian models—can be readily implemented through SQL’s data transforms.
Why is SQL so powerful? Perhaps its strongest feature is that a query describes the results rather than laying out the step-by-step algorithms for calculating those results. Analysts can think about what they are doing rather than how the computer does it. Focusing on the business problem and the data is a big gain for data analysis.
This is particularly important in a world where the same query can be run on data in different environments, such as:
- On different databases
- On single-processor hardware
- On multiple-processor hardware
- On mobile devices
- With different types of indexes
As an example, consider a simple query to extract the maximum value from a column:
SELECT MAX(col)
FROM t
How might this query be executed? Here are four different ways:
- The database engine might read the table row by row, keeping track of the maximum value.
- The database engine might be column oriented, allowing it to read only the values in the column of interest rather than entire rows. The database then keeps track of maximum value as before.
- The database engine might be running on multiprocessor hardware so each processor/thread might read a different part of the table, keeping track of the maximum value. The engine then combines the maximums from each portion to get the overall maximum.
- If an index is available on the column, then the database engine can simply look up the maximum value in the index.
The details of the different execution plans are not important. What is important is how a single, simple SQL statement can result in vastly different execution plans—and the person writing the query only needs to think about getting the maximum value. The SQL engine decides on the rest.
Database engines implement a compendium of complex algorithms for processing data in memory and on disk. These algorithms include sophisticated techniques for sorting data, creating and using hash tables (including out-of-memory hashing and parallel hashing), algorithms for processing joins and aggregations, and clever use of indexes when they are appropriate. Increasingly, the powerful algorithms are available to support other types of data, such as text and geospatial data.
How does one use these algorithms? A user simply needs to know how to write a SQL query. All databases have an optimization component for translating the SQL into more powerful algorithms available on that system.
That observation is the strongest answer to “Why SQL?” SQL is a (relatively) standard language supported by many different data stores. Simple databases such as a SQLite support SQL on mobile devices. Comprehensive relational databases such as Postgres, SQL Server, Oracle, Teradata, and DB2 have literally decades of research and development under their hoods.
SQL itself is so versatile that even so-called NoSQL databases often support a variant (e.g., Cassandra has CQL, Couchbase has N1QL, and RazorSQL “compiles” SQL for DynamoDB). Newer big data solutions such as PrestoDB, BigQuery, Hive, Impala, and Amazon Redshift all offer SQL-based interfaces.
SQL (and databases in general) offer other benefits for analysts. Views and user-defined functions make it easier to encapsulate common logic. Automating useful one-time analyses is a challenge—and the structure and functionality provided by relational databases can help turn ad hoc analyses into applications. Changes to data can be tracked in tables over time, and the “relational model” of data has been extended to support many other data types such as text, geospatial coordinates, JSON, and XML. SELECT, JOIN, and GROUP BY are not going away.
Gordon S. Linoff has just finished the second edition of his book Data Analysis Using SQL and Excel. He is the founder of Data Miners, Inc., a boutique consulting company specializing in data mining and big data projects.


Graph Literacy and Business Intelligence: Investigating User Understanding of Dashboard Data Visualizations
Simon Wakeling, Paul Clough, James Wyper, and Amy Balmain
It is now commonly accepted that data visualizations offer a valuable means of communicating business intelligence to users. However, although much time and effort has been expended on developing rich dashboard interfaces and understanding the optimum design of different visualization types, less attention has been paid to graph literacy—whether dashboard users can effectively understand these visualizations.
We describe the results of a gamified study investigating user graph literacy in a range of comprehension levels for a variety of common dashboard data visualizations. Our results show that participants were more successful in understanding some visualizations than others. Those visualizations with which participants were least familiar tended to elicit the fewest correct answers.
More surprising is the relatively poor performance of participants in answering questions relating to data presented in tabular form. We also observe that users remain confident in their ability to understand familiar visualizations even when their actual performance is poor. Perceived performance is more closely related to actual performance when familiarity is low.
In both cases, vendors and managers should be aware of these effects and appropriately support the implementation of new visualizations while considering methods of ensuring accurate use of familiar ones.
Learn more: Read this article by downloading the Business Intelligence Journal (Vol. 20, No. 4).

Highlight of key findings from TDWI's wide variety of research
Barriers to Success with ETMs
Philip Russom, David Stodder, and Fern Halper
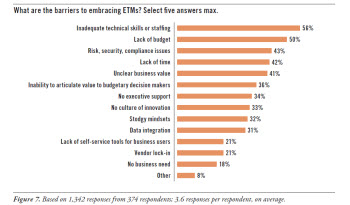
ETMs have benefits, yet they also have barriers (see Figure 7).
The leading barrier to ETM adoption is the state of IT. The barrier may be IT’s inadequate technical skills or staffing (56%, Figure 7), or it could be IT’s failure to provide self-service tools for business users (21%). A number of respondents selected “Other” and mentioned similar complaints, citing a lack of “IT support and buy-in” and “IT infrastructure.” One respondent was diplomatic, pointing out that “IT and the analytics organization have completely different cultures.”
Budgetary issues are the second most common barrier to ETMs. More specifically, there is a “lack of budget” for ETMs (50%). Because ETMs tend to be new, there’s rarely a line item in a budget for them, but another reason may be that the people who want ETMs suffer an “inability to articulate value to budgetary decision makers” (36%). In response to that multiple-choice answer, one respondent selected “Other” and restated the problem as an “inability of budgetary decision makers to recognize the value of ETMs.” Another respondent said, “My industry is in financial crisis, so budget is always the first barrier.”
With new data and new tools, it takes time to establish best practices. This is especially true with risk, security, and compliance issues (43%). In a related vein, most users interviewed for this report spoke of the importance of adjusting older programs for data stewardship and data governance to accommodate new tools, practices, and data resulting from ETMs. Though this is hard work, interviewees didn’t see the adjustments as actual barriers.
Like anything in IT, ETM adoption is unlikely without a business case. For example, “unclear business value” (41%) is a fairly common barrier. If there is “no business need” (18%), there will be “no executive support” (34%).
Innovation culture isn’t as common as it should be. Many organizations suffer “stodgy mindsets” (32%), such that there is “no culture of innovation” (33%) for either IT or the business. Stodgy thinking aside, risk aversion by management is also lethal to ETM adoption and other innovations. One respondent said that, among his senior managers, “no one takes a risk for business results.”
(Click for larger image)
Read the full report: Download the TDWI Best Practices Report Emerging Technologies for Business Intelligence, Analytics, and Data Warehousing (Q4 2015).


FlashPoint Rx prescribes a "Mistake to Avoid" for business intelligence and data warehousing professionals.
Mistake: Turning a Blind Eye to the Potential of In-Memory and Cloud Computing
David Stodder
Once self-service visual BI and analytics technologies have landed in an organization—often at the selection of one business group or function, not at IT’s direction—their use is likely to expand to other groups or functions. The demand for more data and more frequent access grows with the number of users. Organizations need to plan how they will scale up.
There are many possible technology solutions when it comes to scalability. We focus here on two that are becoming important for visual BI and analytics expansion.
In-memory computing. One of the most important technology innovations for analytics is in-memory computing, which exploits more random access memory (RAM) for holding data and performing analytic operations. In-memory computing is not always appropriate, but it can be important for many kinds of analytics activities.
Analytics can suffer if delays and overhead are associated with having to constantly read data from tables stored on disk. In-memory computing can bypass the disk I/O bottleneck and reduce the need to preprocess the data. In-memory computing therefore fits well with demands for “speed-of-thought” analysis and flexible, iterative styles of inquiry against more than just samples or summaries of data. Organizations can use in-memory analytics engines to scale not only for faster analytic operations against potentially millions of rows of data but also to support more users.
Cloud computing. Cloud computing and software as a service (SaaS) for BI, analytics, and data warehousing are maturing, giving organizations more options for servicing demand for BI and visual analytics. The options give the business choices for addressing growing demand without adding significantly to the IT function.
Cloud and SaaS are not yet the mainstream for BI and analytics, in part because of concerns about data security. However, some organizations are letting users experiment with cloud-based BI and visual analytics tools first; they can determine later if the experience merits the bigger commitment of establishing an on-premises system. Cloud can help organizations satisfy users’ needs for data experimentation and provide an alternative to the expenses and time required to build an on-premises system.
Read the full issue: Download Ten Mistakes to Avoid When Deploying Visual BI and Analytics for Business Decisions (Q4 2015).

