
 View online: tdwi.org/flashpoint


January 14, 2016
ANNOUNCEMENTS
NEW Best Practices Report
Operationalizing and Embedding Analytics for Action
NEW Checklist Report
Seven Best Practices for Adopting Data Warehouse Automation
NEW Checklist Report
Seven Steps to Faster Analytics Processing with Open Source: Realizing Business Value from the Hadoop Ecosystem
NEW Ten Mistakes to Avoid
When Deploying Visual BI and Analytics for Business Decisions
NEW TDWI E-Book
Data Warehouse Automation: Accelerating Business Results
NEW TDWI Assessment Tool
Hadoop Readiness Assessment
CONTENTS

The Importance of Data Preparation to Predictive Analytics


Visual Analytics and Decision Management

Mistake: Missing the Opportunity to Make Progress Toward More Advanced Analytics

See what's
current in TDWI Education, Events, Webinars,
and Marketplace
The Importance of Data Preparation to Predictive Analytics
Keith McCormick
Senior Consultant, The Modeling Agency, LLC
In building a data warehouse, organizations expend considerable effort in data cleansing. Most predictive analytics modeling is done with data that resides in a data warehouse or data mart. Why does it still take weeks and weeks to perform data preparation during predictive analytics projects? In short, it is because a great deal of the work is not related to data cleansing.
In his well-received article Nine Laws of Data Mining, Tom Khabaza identifies the third law as the Data Preparation Law: “Data preparation is more than half of every data mining process.” Data prep doesn’t simply involve the drudgery of cleansing data. If it were only that, automated data preparation technologies would be more successful. You can only anticipate some of the problems in advance. As Khabaza explains, “The purpose of data preparation is to put the data into a form in which the data mining question can be asked, and to make it easier for the analytical techniques (such as data mining algorithms) to answer it.”
How do data scientists spend all those weeks on a lengthy project? Here are just three examples of high-priority activities:
1. Making sure the modeling data set reflects the problem. In their book Big Data: A Revolution That Will Transform How We Live, Work, and Think, Viktor Mayer-Schönberger and Kenneth Cukier emphasize that these days, with our powerful computers, there is never any sampling; rather, N=all. In other words, they argue, give us everything and run it through the model. This is never the case on the projects that I work on. I have to start with and examine all of the data, certainly, but the data I actually model reflects the data I will deploy the model on. For example, if I’m generating a model to incentivize business-to-consumer transactions, it is natural that I will remove business-to-business transactions.
This might seem obvious, but it is often a great deal of work to narrow down the object of your analysis, carefully define what is in scope and out of scope, and formalize the definition so that you are ready for deployment. All of these tasks have to be sorted out in the very first planning phases, well before any modeling can be done. Questions such as “Who is a loyal customer?” and “Who is a repeat customer?” are tougher to answer than they seem at first.
2. Aggregating the data. The data is already rolled up, so why do we need to worry about that? It’s because the data was rolled up and aggregated for another purpose—to support routine reporting. The internal client was the finance team or management, not the analysts. They will have completely different data needs that cannot possibly be anticipated until the modeling project is defined. This almost always means going to the most granular level possible and rolling the data back up again. For example, during a cellphone project years ago, I was trying to model customer behavior. For obvious reasons, phone activity that generated a charge on the billing statement was readily available, but activity that was no charge, under a bundle of services, was not. For something as simple as the number of text messages a month, whether customers paid for them or not, I needed raw data.
3. Data “construction” is perhaps the most important of all. Modeling algorithms are not magic. It takes a lot of work to make it easier for the analytical techniques. Dates are a great example. Data warehouses store dates. Many rookies in predictive analytics just throw them into the model. Only in the most extreme examples will you get lucky enough to find something. Veteran data miners know to calculate the distances between dates and then discard the raw date information. Even a handful of key dates could generate dozens of data distances to calculate and explore.
Another common example is “deltas.” Has the number of monthly international text messages minus the average number of monthly averages been trending up, down, or sideways? No data warehouse would ever store these kinds of values for two reasons: (1) no one stores calculations; and (2) these are not the kinds of values you would find in a finance or management report. In short, no business intelligence internal customer would ever need them, so they must be created from scratch to meet the needs of a specific analytics project.
Summary
It is a famous observation that 70–90 percent of a typical predictive analytics project is dedicated to data preparation. Although we’re presented a partial list of the activities and entire books have been dedicated to this activity, it offers a glimpse into what all of those data scientists are doing behind the scenes.
Keith McCormick is a senior consultant at The Modeling Agency, LLC. He is a highly seasoned, career-long practitioner in predictive analytics. His forthcoming book, his fourth, Effective Data Preparation for Predictive Analytics, coauthored with Bob Nisbet for Cambridge University Press, will be released in mid-2016. Keith presents multiple learning tracks at TDWI Conferences and will present at TDWI Las Vegas 2016 (January 31–February 5).


Lessons Learned Supporting a Large-Scale, Real-World Production Data Warehouse/Business Intelligence Environment
Pedro Cerqueira
It’s not uncommon for data warehouse/business intelligence (DW/BI) projects to go into production without proper ongoing support. This is often the reason so many projects fail to deliver their true business value and are, consequently, forgotten by the business users.
There is life after development and deployment. This is the time for the DW/BI support team to ensure the appropriate function and usage of the DW/BI environment from both an IT and business perspective.
As DW/BI becomes mission critical to an organization’s strategy, supporting the DW/BI environment is a key element for a positive return on investment. To accomplish this, the DW/BI support team must employ a unique set of skills. They need to know the organization from its different perspectives: technological, business, data, and personnel.
This article unveils aspects of the most common difficulties faced when an enterprise supports a large-scale, real-world production DW/BI environment. It explains the impact on an enterprise and shares lessons drawn from experience. .
Learn more: Read this article by downloading the Business Intelligence Journal (Vol. 20, No. 4).

Highlight of key findings from TDWI's wide variety of research
Visual Analytics and Decision Management
Today, organizations are looking for opportunities to optimize business processes through smarter and faster decisions. In financial services, banking, insurance, e-commerce, and other industries, organizations want to identify decisions that are repeatable and could be automated. Firms in these and other industries need to accelerate credit approval, monitor fraud and misuse in real time, and improve the consistency of responses to thousands of customers. They also need management capabilities with easy-to-use interfaces designed for nontechnical personnel so they can orchestrate and govern fast decisions across multiple systems and channels.
A trending solution is “decision management,” which is about using analytics to improve and optimize processes. It consists of a set of processes and technologies that can be implemented particularly for real-time, high-volume decision making where many, though not all, decisions can and must be automated. Decision management requires a combination of technologies including predictive analytics, artificial intelligence, business rules management, complex event processing, and business process management.
Visual analytics can play a key role in decision management. First, tools and applications can help business managers identify areas where optimization is possible and where decisions could be automated. Second, visual analytics can improve the human interface to decision management systems, giving managers tools for monitoring and continuous improvement. Some visual business analytics tools and applications can help managers with scenario analysis and simulations to see the potential impact of decision management.
Decision management intersects with the idea of embedded analytics: that is, incorporating BI reporting and analytics functionality inside other applications and business processes such as those for customer relationship management, contact center and customer service, ERP, supply chain management, and portals. Embedded visual analytics can improve the user experience of these applications and make them more data-oriented to go along with the normal processes and procedures.
Visualizing Operational Performance
TDWI Research asked participants about the importance of a variety of steps for integrating analytics with business applications, processes, and workflow to improve operational performance (see Figure 12). Three quarters (75%) of research participants said integrating visual analytics with business process management was important, with 39% indicating it was very important. This result underscores the importance of operational efficiency as a business driver behind implementation of visual analytics and its potential as a contributing technology for decision management.
(Click for larger image)
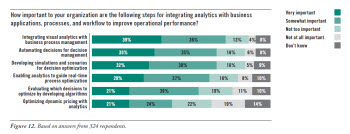
Nearly as many (70%) said automating decisions for decision management was important, with the same percentage (70%) indicating the importance of developing simulations and scenarios for decision optimization. Clearly there is interest in bringing visual analytics to bear on decision management and process improvement. We expect organizations to continue to explore ways of tightening this integration to meet objectives where smarter and faster decisions create a competitive advantage.
Read the full report: Download the TDWI Best Practices Report Visual Analytics for Making Smarter Decisions Faster (Q3 2015).


FlashPoint Rx prescribes a "Mistake to Avoid" for business intelligence and data warehousing professionals.
Mistake: Missing the Opportunity to Make Progress Toward More Advanced Analytics
David Stodder
Most new users of self-service visual BI and analytics tools and applications have been implementing only spreadsheets, simple reporting applications, or standalone desktop databases. Some may have experience with enterprise BI systems, although mostly as consumers of visualizations such as dashboards and scorecards, not as authors of BI reports and queries. Select power users of OLAP systems, mostly business and data analysts, will have experience drilling down into data, slicing and dicing, and manipulating data in hierarchies and aggregations. However, the majority of users will not be very mature in their use of analytics for decision making.
Simpler, easier, and more visual tools are likely to spike users’interest in doing more diverse and advanced forms of analytics. Organizations should encourage this interest; they should guide users to learn about advanced analytics capabilities, how analytics can serve business goals and objectives, and how self-service visual analytics could improve their mode of consuming and sharing analytics. In particular, organizations should provide training in how to build and validate analytics models and encourage user collaboration with data scientists and statisticians in modeling processes. IT and data management functions can contribute by helping users understand the quality and consistency of the data they are using for modeling and other analytics processes—and begin to work jointly to improve data sources so the results of analytics processes can be trusted.
One type of more advanced analytics growing in popularity is location (or geospatial) analytics. Many visual BI and analytics tools now enable users to engage in data-rich, thematic mapping and spatial analysis that can reveal visually how sales are trending across a geographical area, whether field service resources are being distributed optimally, and other dimensions that are often harder to interpret in standard tables and charts. Location analytics could be a good starting point for users seeking to advance their business analytics.
Read the full issue: Download Ten Mistakes to Avoid When Deploying Visual BI and Analytics for Business Decisions (Q4 2015).

