 View online: tdwi.org/flashpoint


February 6, 2014
ANNOUNCEMENTS
NEW TDWI E-Book:
Big Data Management
NEW TDWI Big Data Maturity Model and Assessment Tool
Take the Assessment Now
CONTENTS

Let’s Start by Listening to Our Data

Filling the Demand for Data Scientists: A Five-Point Plan

Usage Rates for Big Data Management Today

Mistake: Assuming Your Data Strategy Is Independent from Technology

See what's
current in TDWI Education, Events, Webinars,
and Marketplace
Let’s Start by Listening to Our Data
Gian Di Loreto, Ph. D.
Loreto Services and Technologies
Topics:
Data Analysis and Design, Performance Management
Introduction
While out Christmas shopping last December with my wife, we were taken in by a display showing off a device that promised to “help you reach your fitness goals” when affixed to your wrist. I can’t pass up things that collect data, and my wife (like a lot of us) can’t pass up things that take your money and promise to make you healthier.
I have been wearing this device for about a month now, and the data is starting to pile up. The device comes preset with a goal of 10,000 steps per day--a purely arbitrary number. I have only hit this goal once when I went on a hike with my daughter. I was rewarded with some flashing lights and a buzzing on my wrist.
I like the device and I find the data it collects and the reporting it provides (especially the study of sleep habits) very useful; however, it occurs to me that a more meaningful goal would be for the app to track your average steps per day and reward you when take more steps than usual. This is a simple customization that would give people motivation not just to take a certain number of steps but to move more than they are used to.
Our Old Friends the Mean and Standard Deviation
I recall reading an article in my college newspaper by a student bemoaning the introduction of the mean and standard deviation into his instructor’s grading scheme. This student had scored 80 percent on a test, but because the mean was higher, he received a letter grade of “C.”
The relatively simple analysis that provides us the mean and standard deviation belies its usefulness. When dealing with data, we should resist the temptation to insist on random numerical goals. Rather, we should listen to what our data is telling us and use that historical data to tell us if new data is behaving as we might expect.
The teacher was correct to give a lower grade to the student who, although getting a decent fraction of questions correct, still performed poorly compared to the rest of the class, who were exposed to the same learning opportunities. Likewise, the fitness app should use my history to tell me if I’m having a good or a poor day in terms of keeping moving rather than use an arbitrary goal.
How Things Are vs. How They Should Be
These examples of the usefulness of the mean and standard deviation are obvious to most readers, I expect. However, while observing current market offerings in data profiling software, I still see a preponderance of tools that guide the user through the process of creating a business rule by building a framework for the user and then asking, in effect, what percent change of this data element should trigger a business rule.
My experience suggests that this represents our collective way of looking at data. We all understand the usefulness of historical data and using it to collect useful, predictive statistics. In practice, however, we create business rules attached to arbitrary percent (or worse, absolute value) changes. The tools lead us down this troublesome path. These rules are then tripped by perfectly good data and are subsequently ignored, eventually allowing actual bad data to flow.
We collectively suffer from inertia: this is how we have always done things, so why don’t we start off from that perspective and maybe we can introduce a better analysis later. However, later usually comes when we are online and it’s too late.
I suggest instead that we begin any data-centric project with a different mindset. Forget what you expect, look at what you have, and create business rules to help you notice when the data is misbehaving--not by your standards but by its own. This might sound like a subtle change; it isn’t. If we all start out with this mindset, we can find ourselves one step closer to all that elusive good, clean data.
Conclusion
As for my personal fitness, I’m still waiting my second day of 10,000 steps. I’m certainly not going to lower that goal (what would that say about me?) and I have enough work-related programming to do that I can’t write my own app to calculate my average day and determine when I’m having a good fitness day. You can fool the device, though--I’ve discovered it will confuse banjo picking with stepping, so on days when I play a lot, I get credit for more steps. I’m hoping that this is also true for typing, in which case I’ll get a little more credit today as well!
Gian Di Loreto, Ph. D., is an experimental physicist by training and runs Loreto Services and Technologies, a consulting firm specializing in data quality. There, he is responsible for everything from sales to implementation to refilling the printer paper.


Filling the Demand for Data Scientists: A Five-Point Plan
John Santaferraro
Big data offers enterprises big opportunities. To make sense of all the information being produced and collected, enterprises have been turning to data scientists, those geeks with proficiency in parallel processing, MapReduce, petabyte-sized NoSQL databases, machine learning, and advanced statistics. There’s just one hitch: a McKinsey report suggests that by 2018, a shortage of data scientists will emerge, ranging from 140,000 to 190,000 in the U.S. alone.
How can enterprises cost-effectively prepare for their data-driven future in the face of this shortage? The solution is an internal program that provides the opportunity for existing data analysts, BI analysts, and business analysts to acquire the skills they need to become big data analysts. These big data analysts then perform the predictive and prescriptive analysis and discovery needed to innovate and compete effectively.
Along with developing education programs, companies need to consider providing incentives for existing analysts to participate, reorganizing their analyst community to support big data analysts, deploying technology infrastructure to support analytics, and fostering an enterprisewide culture of analytics.
Read the full article and more: Download Business Intelligence Journal, Vol. 18, No. 4


Highlight of key findings from TDWI's wide variety of research
Usage Rates for Big Data Management Today
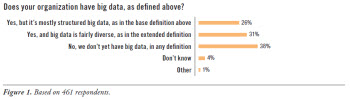
Big data management is important to companies and other organizations that have big data to manage, but big data is still relatively new, so how many organizations actually have it? To quantify this issue, the survey for this report presented the above definitions of big data and data management, and then asked: “Does your organization have big data, as defined above?” (See Figure 1.)
Big data regularly focuses on structured data. The survey bears this out; a quarter of respondents (26%) reported that their big data is mostly structured, as in the base definition above.
The full range of big data is being managed by real-world organizations today. Thirty-one percent of respondents reported that their big data is fairly diverse, as in the extended definition.
Most organizations are managing some definition of big data today (57%). This is true if you combine responses for the base definition of big data (26%) and the extended one (31%). This indicates that big data and its management have crossed into mainstream usage.
For many organizations, big data has not yet arrived. More than a third of respondents (38%) said they don’t yet have big data, in any definition. Oddly enough, the survey population for this report has unusually large percentages of respondents from the two kinds of organizations that are most prone to big data: namely, midsize-to-large Internet firms and very large corporations (with $10 billion of annual revenue or greater). Without these concentrations in the survey population, the percent of organizations without big data would no doubt have been higher, but still less than a majority.
(Click for larger image)
Read the full report: Download Managing Big Data (Q4 2013)


FlashPoint Rx prescribes a "Mistake to Avoid" for business intelligence and data warehousing professionals.
Mistake: Assuming Your Data Strategy Is Independent from Technology
Mark Madsen
If you assume that your data strategy is wholly independent from technology, you will make a different mistake than assuming the strategy is about technology choice. Data technologies go through cycles of renovation. We are currently in a period of technology innovation that is changing the cost of storing and processing data by orders of magnitude. This cost shift enables entirely new practices that were previously too expensive or complex.
However, we’re hampered by the implementation choices made years ago that didn’t anticipate the rate of change in costs. Many companies built their infrastructure assuming the long-term stability of their vendors and technologies, ignoring the fact that there is large-scale change approximately every 10 years. The assumption of stability led to technical decisions that precluded changing core parts of the IT architecture.
Technology choices both enable and constrain strategies--that is the nature of technology. These constraints and enabling characteristics are part of the input into a data strategy. When combined with the capabilities required to achieve business goals, the combination of needs and constraints allows you to determine the best tactics to move forward.
Read the full issue: Download Ten Mistakes to Avoid When Creating Your Data Strategy (Q4 2013)

