 View online: tdwi.org/flashpoint


October 1, 2015
ANNOUNCEMENTS
NEW Digital Dialogue
Unifying the Traditional Enterprise Data Warehouse with Hadoop
NEW 2015 BI Benchmark Report
Organizational and Performance Metrics for Business Intelligence Teams
NEW Best Practices Report
Emerging Technologies For Business Intelligence, Analytics, and Data Warehousing
NEW Ten Mistakes to Avoid
Ten Mistakes to Avoid In Predictive Analytics Efforts
CONTENTS

DPaaS: A Prerequisite to Effective BI in Today’s Dynamic Data Environment

Hadoop's Benefits and Barriers: Benefits of Hadoop

Mistake: Failure to Control Output

See what's
current in TDWI Education, Events, Webinars,
and Marketplace

Databases vs. Data Streams
Dave Wells
BI Consultant, Mentor, and Teacher
Data streams are among the most challenging of big data sources. Most of us are familiar with the concept of streaming data through experiences of streaming music or video. We’ve seen what happens when network bandwidth or processor speed is insufficient—the video freezes and skips panes; the music skips and stutters. Freezes, skips, and stutters can also happen in streaming analytics (e.g., while streaming a Twitter feed to a real-time customer sentiment dashboard). The user experience will be equally frustrating and the consequences may be much more severe than in streaming for entertainment.
The streaming analytics pipeline begins with data streams and typically ends with data visualization. Much processing occurs between the two endpoints to filter and aggregate data, manage moving time windows for data of interest, apply analytic algorithms, and render charts and other data visualizations.
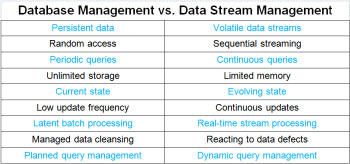
Data stream management is arguably more difficult than database management. Managing data in motion is certainly different from managing data at rest. The table below itemizes the significant differences between database management and data stream management.
A Closer Look
Persistent data vs. volatile data streams: Data in databases is persistent—it is available to be processed at your convenience and can be reprocessed in the event of an error. Data streams are transient and must be processed as the data passes through the stream processor. Delayed processing is not an option, and reprocessing or replay is only possible if initial processing stores the data.
Random access vs. sequential streaming: Data in databases is randomly processed using keys and indexes. Streams arrive sequentially, with each record processed in the order it arrives.
Periodic queries vs. continuous queries: Applications using data from databases issue queries when they need to access data. Streaming applications, such as a real-time dashboard query, enable the continuous flow of real-time data to the consumer.
Unlimited storage vs. limited memory: Database processing can assume virtually unlimited storage. Data volume doesn’t severely constrain processing capacity. Stream processors work with data in memory, and memory is far from unlimited. The distributed, fault-tolerant processing fundamental to big data technologies such as Hadoop is essential for stream processing.
Current state vs. evolving state: Database-oriented applications collect, store, and report data about the current state of something of business interest. The data is inherently state-oriented. Stream processing receives data in real time and frequently must create a view of the evolving state across a sliding time window.
Low update frequency vs. continuous update: Database applications have relatively low frequency of updates that is typically driven by a similarly low velocity of transactions. Streaming applications update continuously (e.g., constantly refreshing visual objects on a real-time dashboard).
Latent batch processing vs. real-time stream processing: Database processing, such as extract, transform, and load (ETL), processes data in batches. Batch processing always involves data latency. Smaller and more frequent batches, often called minibatches, reduce but do not eliminate latency. Real-time stream processing achieves near-zero data latency. True zero latency isn’t realistic because processing always takes some time—even if it’s only milliseconds. Some stream processors use a microbatch concept—extremely small batches and exceptionally high frequency processing to achieve extreme low-latency.
Managed data cleansing vs. reacting to data defects: Many of the data transformations in an ETL process are designed to improve data quality. These types of transformations are practical in batch processing but difficult to achieve with real-time stream processing. Complex transformations that work with data groups and data relationships simply aren’t practical in stream processing. Streams must react to data defects with operations such as filtering.
Planned query management vs. dynamic query management: In the world of databases, query optimization is a common practice. We structure and organize data for query performance, and we use the query optimization features of database management systems. Stream processors must respond to query management in real time as continuous queries occur. Query optimization in stream processing uses features of parallel processing and workload distribution.
Summary
Understanding the differences between database management and stream management is important for every developer who is expanding beyond database applications and into streaming applications. Adjusting design and development practices to account for the differences helps to deliver streaming applications without freezes, skips, and stutters.
Dave Wells is actively involved in information management, business management, and the intersection of the two. As a consultant, he provides strategic guidance for business intelligence, performance management, and business analytics programs. He is the founder and director of community development for the Business Analytics Collaborative.

DPaaS: A Prerequisite to Effective BI in Today’s Dynamic Data Environment
Manish Gupta
Without a strong pipeline of quality data, the best BI tools and the smartest data scientists are rendered irrelevant. Quality data, however, is getting harder and harder to come by. Dramatic changes in the landscape—think big data and cloud—are overrunning enterprises’ ability to stay in front of the critical integration and data management operations that are fundamental to quality data.
Data platform-as-a-service (DPaaS) is an emerging solution category that directly addresses the integration and data management challenges posed by today’s disruptive data technologies. This article highlights the innovations that set DPaaS apart from other integration solution models and details why these innovations are so important for effective BI.
Learn more: Read this article by downloading the Business Intelligence Journal, Vol. 20, No. 3.


Highlight of key findings from TDWI's wide variety of research
Hadoop's Benefits and Barriers: Benefits of Hadoop
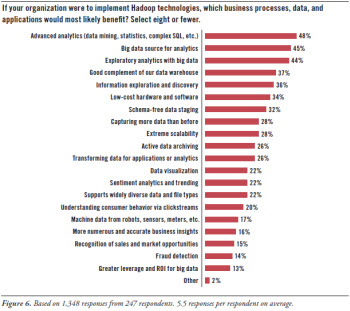
In the perceptions of survey respondents, Hadoop has its benefits. (See Figure 6.)
Advanced analytics. Hadoop supports advanced analytics, based on techniques for data mining, statistics, complex SQL, and so on (48%). This includes the exploratory analytics with big data (44%) that many organizations need to do today. It also includes related disciplines such as information exploration and discovery (36%) and data visualization (22%).
Data warehousing and integration. Many users feel Hadoop complements a data warehouse well (37%), is a big data source for analytics (45%), and is a computational platform for transforming data (26%).
Data scalability. With Hadoop, users feel they can capture more data than in the past (28%). This is the perception, whether use cases involve analytics, warehouses, or active data archiving (26%). Technology and economics intersect because users feel they can achieve extreme scalability (28%) while running on low-cost hardware and software (34%).
New and exotic data types. Hadoop helps organizations get business value from data that is new to them or previously unmanageable, simply because Hadoop supports widely diverse data and file types (22%). In particular, Hadoop is adept with schema-free data staging (32%) and machine data from robots, sensors, meters, and other devices (17%).
Business applications. Although survey respondents are focused on technology tools and platforms, they also recognize that Hadoop contributes to a number of business applications and activities, including sentiment analytics (22%), understanding consumer behavior via clickstreams (20%), more numerous business insights (16%), recognition of sales and market opportunities (15%), fraud detection (14%), and greater ROI for big data (13%).
Read the full report: Download Hadoop for the Enterprise (Q2 2015).


FlashPoint Rx prescribes a "Mistake to Avoid" for business intelligence and data warehousing professionals.
Mistake: Failure to Control Output
Fern Halper
Predictive analytics is easier to use than ever. In the past, to build a predictive model required a scripting language or learning some sort of programming tool; today, vendors are providing point-and-click and drag-and-drop interfaces to make building the predictive models easier. Some vendors have even gone so far as to have the software ingest the data, determine the outcome variables, suggest which model is best for the data, and automatically run a model. Many vendors also provide collaboration features so that if someone with basic skills builds a model, he or she can share it with a more experienced person to get feedback. Some will even speak back the findings!
This makes predictive analytics easy to use, and many organizations plan to have business analysts with no formal training in statistics using the tools. These organizations will make a mistake if they do not get training (see Mistake #4) as well as institute a process to control model deployment. Successful organizations are allowing non-quants to build models, but they are putting a process in place whereby the model is first checked by a data scientist or statistician or quantitative expert before it goes into production. This inserts controls into the process. Controls are critical for any model in production.
Read the full issue: Download Ten Mistakes to Avoid In Predictive Analytics Efforts (Q3 2015).


