 View online: tdwi.org/flashpoint


September 3, 2015
ANNOUNCEMENTS
NEW Data Innovations Showcase
Modernizing Your Data Warehouse for Cutting-Edge Analytics
NEW E-Book
Data Integration and Management: A New Approach for a New Age
NEW Infographic
Visual Analytics for Making Smarter Decisions Faster
NEW Ten Mistakes to Avoid
Ten Mistakes to Avoid In Predictive Analytics Efforts
CONTENTS

Kanban for Newly Agile Data Warehouse and Business Intelligence Teams

From Layers to Pillars—A Logical Architecture for BI and Beyond

Organizational Practices for Hadoop: Staffing Hadoop

Mistake: Limiting MDM to Single-Department, Single-Application Solutions

See what's
current in TDWI Education, Events, Webinars,
and Marketplace

Kanban for Newly Agile Data Warehouse and Business Intelligence Teams
Lynn Winterboer
Agile Analytics Educator and Coach
Data teams brand-new to agile typically start by implementing the most popular agile framework, Scrum, hoping to achieve the success they’ve seen from their software brethren. The data warehouse and business intelligence (DW/BI) teams that are most succesful with Scrum already have a robust infrastructure. They also have the technical discipline that enables push-button builds, continuous integration, automated testing, and production-quality testing.
However, I have found that most DW/BI teams do not have this type of infrastructure and technical discipline built out. Teams without these essential practices spend a majority of their Scrum sprint focused on manually managing builds, migrations, and testing, leaving little time for developing new, valuable DW/BI functionality.
I recommend that DW/BI teams new to agile evaluate several agile frameworks prior to choosing one. Certainly Scrum is a good candidate for some. Extreme Programming (XP) is another good candidate. This article describes another option, Kanban, which is very effective for teams disciplined enough to embrace it.
Kanban will help your team measure and incrementally improve your delivery approach. In my experience, the main benefits to a data team of using Kanban are the heavy use of metrics to drive improvement decisions (right up our alley!), its focus on reducing waste, and increased predictability.
Metrics
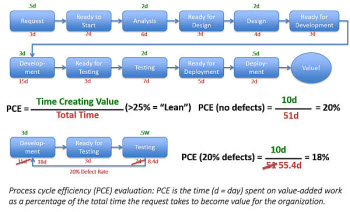
The foundation of Kanban is visualizing the work as it flows through the steps in the delivery process, measuring the time spent in each step along the way. Kanban leverages lean value-stream-mapping practices to measure the process cycle efficiency (PCE) of the DW/BI team’s delivery cycle. PCE is the time spent on value-added work as a percentage of the total time the request takes to become value for the organization. (See flowchart below.)
Reducing Waste
Measuring the PCE of each iteration of value provides the DW/BI team members with the metrics they need to reduce waste and get value into their stakeholder’s hands sooner. Metrics help the teams understand where their processes have bottlenecks (waiting) and inefficiencies (long duration for shorter amount of actual value creation). The goal is to see the amount of waste get smaller over time, thereby increasing PCE and delivering value faster. This is the kind of thing we want to see our organizations do using the information we provide them. It’s our turn to apply what we do well to our own delivery processes!
Two key ways DW/BI teams can reduce wasted time are by limiting work in process (WIP) and by making process improvements. Limiting WIP significantly reduces waiting time between steps in the process for a single iteration of value. By limiting WIP for a team, the organization makes a business decision to prioritize the delivery of value to the organization—over “100 percent utilization” of team member time. You can see in the flowchart above that this team is clearly not limiting WIP, because there is so much waiting time between steps and the duration of each step is much longer than the value creation time. For example, the reason the request sits in the “Development” step for 15 days, even though it only took 3 days of actual development time, is likely due to this team being spread across too many projects or tasks at one time. For a more detailed description of limiting WIP for DW/BI teams, see my article "Project Management: Do Less by Committing to More."
In the meantime, there will be days when team members do not have useful project tasks to work on. This is the perfect time for them to make process improvements to their work, so the next time they will create value faster by spending less time waiting, manually handling automatable tasks, and expending unnecessary effort. For example, team members could focus on:
- Researching and implementing a test automation framework
- Building automatable regression tests for existing functionality
- Learning about hyper-modeling approaches that allow for faster and more flexible changes as requirements evolve
- Streamlining project documentation requirements
- Automating build and deployment procedures for development, test, and production environments
Increasing Predictability
Measuring the team’s short increments allows the team to understand where waste is occurring and determine how long it takes, on average, to deliver business requests. The team can use these metrics to establish a “reality-based” expectation as to how long requests take from initial request to final production.
For example, a team could plot their complete cycle times (request through delivery of value) for all requests over a period of time on a scatter chart. From this, they might determine that 98 percent of requests are completed in 28 days or less. That metric implies that the organization this team supports can expect their requests to be met within 28 days for 98 percent of their requests.
Summary: The Choice Is Yours
Now that you have a sense for some of the key benefits of using Kanban in your agile approach to DW/BI, your team can decide for itself whether the metrics, improvements, and predictability inherent in Kanban are a good fit for your organization.
Lynn Winterboer teaches and coaches data warehouse and business intelligence (DW/BI) teams to effectively apply agile principles and practices to their work. For 20 years, Lynn has served in numerous roles on analytics and DW/BI teams. She understands the unique set of challenges faced by DW/BI teams who want to benefit from incremental agile project delivery. Clients include Capital One, Wal-Mart, Intel, Bankrate Insurance, CoBank, Sports Authority, Polycom, and McAfee. She can be reached at www.LynnWinterboer.com.

From Layers to Pillars—A Logical Architecture for BI and Beyond
Barry Devlin
The traditional BI architecture approach consists of a single stack of layers with data managed and moved from layer to layer. There were (and still are) good reasons for this design, but modern business needs drive another approach. Today’s speed of response and breadth of data types dictate an architecture composed of pillars of data across multiple technologies and a new approach to integrating metadata as context-setting information across these pillars.
This article outlines the conceptual- and logical-level architectures that emerge from the data and processing needs of modern business operating in a world of abundant information, high connectivity, and powerful technology. Recognizing three distinct types of data, the architecture supports shared context across these types and the key role of traditional, modeled data in creating consistency and enabling governance. By defining pillars of data as a logical design, this approach supports optimization of technology choices and eases migration from current implementations, in contrast to the data lake approach favored by some in the industry.
Learn more: Read this article by downloading the Business Intelligence Journal, Vol. 20, No. 2.


Highlight of key findings from TDWI's wide variety of research
Organizational Practices for Hadoop: Staffing Hadoop
An ideal strategy for staffing Hadoop would be to hire multiple data scientists. The challenge for that strategy is that data scientists are rare and expensive. In fact, people with any Hadoop work experience are likewise rare, and (because of demand) most are employed currently without need for a new job. Hence, hiring new employees with Hadoop experience (41% in Figure 10) is a possibility but introduces challenges.
Recall that most business intelligence/data warehouse (BI/DW) teams are heavily cross-trained; each employee has skills in multiple areas, from report design to ETL development to data modeling to data discovery. Having a pool of cross-trained team members makes it easy for a manager to assign people to projects as they arise, and each team member can “pinch hit” for others when necessary. Most BI/DW professionals prefer the diverse work assignments that cross-training enables. Hence, in the tradition of BI/DW cross-training, most teams are training existing employees for Hadoop skills (73%) instead of hiring.
Another tradition is to rely on consultants when implementing something entirely new to the organization or that involves time-consuming and risky system integration. Hadoop fits both of these criteria, which is why many BI/DW teams are depending on consultants for Hadoop skills (36%). Likewise, many teams get their training and knowledge transfer from experienced consultants.
Finally, more than one staffing strategy can be appropriate, and the three discussed here can be combined differently at different life cycle stages. For example, you might start with consultants when Hadoop enters an enterprise, followed by some cross-training, then add more full-time employees as Hadoop matures into enterprise-wide use.
Read the full report: Download Hadoop for the Enterprise (Q2 2015).


FlashPoint Rx prescribes a "Mistake to Avoid" for business intelligence and data warehousing professionals.
Mistake: Limiting MDM to Single-Department, Single-Application Solutions
Philip Russom
Data domains are not the only way to define the building blocks or project scope of master data management (MDM) solutions. As with many IT systems, MDM solutions can apply to single applications or single departments.
For example, many complex applications benefit from an MDM solution designed specifically for them. In fact, applications for enterprise resource planning (ERP), customer relationship management (CRM), and business intelligence (BI) are common starting points for MDM programs because complex applications like these often have business pain points that can be alleviated by MDM. Furthermore, applications are compelling because each defines a manageable scope for MDM efforts. Similarly, applications in these categories are owned and/or used heavily by individual departments, and a department is a convenient scope for MDM.
The problem is that basing MDM solutions on applications and departments can lead to siloed, contradictory, ungovernable, analytically challenged, and non-productive MDM solutions, just as leveraging data domains can. Instead of limiting themselves to single-application, single-department MDM solutions, successful organizations will aspire toward multi-application, multi-department MDM solutions.
After all, the point of MDM is to share data across multiple, diverse applications and the departments that depend on them. It’s important to overcome organizational boundaries if MDM is to move from being a local, uncontrolled fix to an infrastructure for sharing data as a controlled enterprise asset.
Again, a unified and evolving technology plan is key to integrating multiple MDM solutions. However, coordinating multiple departments is best done using strong cross-functional organizational structures, such as data stewardship and data governance.
Read the full issue: Download Ten Mistakes to Avoid When Growing Your MDM Program (Q2 2015).


