 View online: tdwi.org/flashpoint


December 12, 2013
ANNOUNCEMENTS
NEW TDWI E-Book:
Analytics in the Cloud: The Challenges and Benefits
NEW TDWI Checklist Report:
The Modern Data Warehouse
NEW TDWI Checklist Report:
Seven Steps to Realizing Value from Business Intelligence and Discovery Analytics for Healthcare Providers
NEW TDWI Big Data Maturity Model and Assessment Tool
Take the Assessment Now
CONTENTS

Accidental Analysts: What Are They Doing with My Data?

Big Data: The Fourth Data Management Generation

Matching Visual Interfaces to User Requirements

Mistake: Implementing Self Service without a Life Preserver

See what's
current in TDWI Education, Events, Webinars,
and Marketplace

Accidental Analysts: What Are They Doing with My Data?
Eileen McDaniel, Ph.D., and Stephen McDaniel
Freakalytics, LLC
Topics:
Data Analysis and Design
Earlier this year, we spoke to an independent group of data professionals about accidental analysts. We had to laugh when we noticed the talk was mistakenly promoted as “Accidental Analysts: What Are They Doing to My Data?” Unintentional typo or not, we’ve found that data warehousing specialists often wonder what businesspeople are doing on their end.
Who are accidental analysts, how do they analyze data, and which aspects of the data warehouse can data professionals evaluate and improve upon so they are positioned for success instead of frustration?
Who Are Accidental Analysts?
Many business analysts either lack formal education in data analysis or took courses that didn’t fully prepare them for the challenges of real-world data analysis. They are asked to quickly answer business questions so managers, colleagues, and clients can identify and implement a plan of action. After teaching analysts in many organizations at all skill levels and backgrounds, we discovered that a major obstacle to obtaining good results is that many users are uncertain about the steps to take when analyzing their data. They need a plan of attack, regardless of the analysis software they are using!
The Seven Cs of Data Analysis
The scientific method has been used for hundreds of years to design and analyze experiments. In our training and books, we adapted this method to fit business analysis, targeting typical questions that accidental analysts answer and emphasizing common areas of difficulty. This framework is The Seven Cs of Data Analysis. Many experienced analysts tell us these steps are similar to those that they naturally follow when analyzing data. Even better, these steps have given them a guide to directly mentor accidental analysts.
How can data professionals help accidental analysts be more successful? Let’s focus on the first four steps of the seven-step process:
The First C: Choose Your Questions
This is the most often overlooked step because analysts are excited to begin working with the data. However, it is crucial to keeping the analysis on track and arriving at actionable results.
Data professionals are regularly approached by analysts who have not yet fully defined the question they are researching. This can be quite a challenge. The data needed depends on the question, so it is essential to figure out the ultimate goal of the analysis. Helping analysts understand that their questions radically affect what data is retrieved can minimize frustration for both of you. Finally, work with analysts to avoid scoping the question so that it is limited by the available data--there may be data in the organization that your data team isn’t aware of or can be acquired in the future.
The Second C: Collect Your Data
This is typically the most frustrating and time-consuming step of analysis. It is intimidating to an accidental analyst, so refactoring your data infrastructure to minimize these activities will help your team be more successful. Also, if possible, provide them with the tools and knowledge to locate and work with these areas:
- Multiple joins
- Complex calculations
- Cross-platform queries
- Combining OLAP, relational, and local files
- Critical data in people’s heads and spreadsheets
- Third-party and cloud data sources
The Third C: Check Out Your Data
Even a good data platform can have many data issues. Without business context, data teams are limited in their ability to find anomalous outcomes in the data. Leverage the work of accidental analysts for long-term improvements.
The Fourth C: Clean Up Your Data
Analysts frequently clean data locally because they are just plain wrong otherwise! Try not to criticize them; learn from it and better understand the context.
After these last three steps, analysts can be relatively confident that their data is in good form. They understand basic information about their data items (sometimes they even answer their original questions!).
There are three more steps. The fifth and sixth Cs--chart and customize your analysis--involve core techniques and best practices of visual analytics, including matching the appropriate graph or table to the question at hand and arranging or selecting data to look at specific areas of interest. The final (seventh) C--communicate your results--involves presenting the insights from the analysis so others can learn about opportunities and risks and take action.
Other areas in which you can support accidental analysts include: access to data update status, centralized locations for file uploads, and indexing frequently used data tables.
Eileen McDaniel is author of The Accidental Analyst® and director of analytic communications at Freakalytics. Stephen McDaniel is an independent advisor to Chief Data Officers. Both write and teach Accidental Analyst courses, are on the Faculty at INFORMS, and can be reached at www.freakalytics.com.

Big Data: The Fourth Data Management Generation
Hugh J. Watson and Olivera Marjanovic
Companies such as Yahoo! and Google are at the “big data” forefront and have played major roles in developing technologies such as Hadoop and MapReduce for storing and analyzing big data. Most companies, however, are just starting to think about or experiment with the potential uses of big data and how to integrate big data into their existing BI architectures. Big data solutions do not eliminate the need for data warehouses and marts; rather, each data platform has its own role and value proposition.
Although big data is relatively new, the need for data to support decision making has existed since the early 1970s with decision support systems (DSSes). DSSes can be thought of as the first generation of decision support data management. Over time, additional generations have evolved. More specifically, around 1990, enterprise data warehouses (the second generation) appeared. Next, real-time data warehousing (the third generation) came on the scene in the early 2000s, and finally, starting in 2010, big data is creating a new, fourth generation. Each generation both replaced and built on previous generations.
These generations are characterized by scope, focus, decisions supported, users, volume, velocity, variety, data sources, architecture complexity, and value. As we will see, each generation was driven by business need, fueled by technological advances, and faced many implementation challenges.
Read the full article and more: Download Business Intelligence Journal, Vol. 18, No. 3


Highlight of key findings from TDWI's wide variety of research
Matching Visual Interfaces to User Requirements
Dashboards and scorecards should allow users to drill down to at least one if not more levels of data to gain a detailed view behind the KPIs, metrics, and visual objects. Users should be able to spot anomalies easily and recognize where performance is out of line with expectations. More mature and successful dashboard implementations will allow users not only to drill down into data, but also to perform various types of analysis to explore patterns or determine the root cause for why numbers are out of line with expectations.
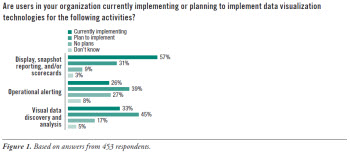
Three out of five (57%) of respondents to the TDWI Research survey are currently implementing display or snapshot reports and/or scorecards; 31% are planning to do so, and 9% have no plans for them (see Figure 1). Among the 7% of respondents noted earlier who are very satisfied with their ability to view and interact with data visually, 77% are currently implementing visualization for these types of activities.
Read the full report: Download Data Visualization and Discovery for Better Business Decisions (Q3 2013)


FlashPoint Rx prescribes a "Mistake to Avoid" for business intelligence and data warehousing professionals.
Mistake: Implementing Self Service without a Life Preserver
Laura Reeves
Self service means something different to almost everyone you talk to. For a majority of business users, self service simply means that you can pick a report and filter the data it displays (for example, select only the month and region you are interested in). For others, self service may be the ability to interact with reports and graphs by drilling into more detail or being able to change what is on the report using a drag-and-drop interface. For an experienced power user or BI developer, self service may mean the ability to examine the sea of available data and build anything from scratch.
Unfortunately, the term self service can be misinterpreted by IT to mean no development and no support. IT may view its role to be limited to building the database and installing a BI tool. This is not enough. IT must continue to be involved to ensure that the BI tool metadata is set up appropriately to accurately represent the data in business terms. A starter set of report templates, with parameter-driven prompts, must be created.
Appropriate education must be provided, as described in Mistake Six. Finally, support must be provided to ensure that the new environment will be used. Some of the support will be technical to make sure the environment is working properly or help people use features of the technology. Support must also be provided to reinforce education to help people use the BI environment in their everyday work. This business support is often provided by more experienced people within the business groups. Don’t just toss the business people into the deep end of the BI pool. Make sure they have a life preserver (power users) and a lifeguard (IT team members) on hand, too.
Read the full issue: Download Ten Mistakes to Avoid When Delivering Business-Driven BI (Q3 2013)


