 View online: tdwi.org/flashpoint


March 8, 2012
ANNOUNCEMENTS
Submissions for the next Business Intelligence Journal are due May 18. Submission guidelines
CONTENTS

Managing Data Quality: Understanding Before Action

The Economy as a
Generational Driver

Mistake: Confusing Technical Architecture with Data Integration Architecture

See what's
current in TDWI Education, Research, Webinars,
and Marketplace

Managing Data Quality:
Understanding Before Action
Dave Wells
Topic:
Data Management
Data quality (DQ) is central to business intelligence (BI) quality and has substantial impact on the business value that BI delivers, yet most of us don’t really know the quality level of our data. We usually have many diverse opinions and lots of anecdotes, but few facts.
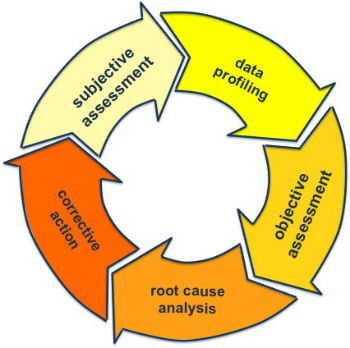
Assessment and data profiling are the tools to overcome this lack of knowledge; efforts to cleanse data without fact-based understanding of data quality have limited impact. Data quality management is a cycle of five activities, with only one activity actually changing the state of the data. Figure 1 illustrates the five activities of the DQ management cycle.
- Subjective assessment: What is the perceived quality of the data?
- Data profiling: What is the actual condition of the data?
- Objective assessment: What is the quantitative quality of the data?
- Root cause analysis: Why is data quality deficient?
- Corrective action: How do we correct and prevent defects?
(Click to enlarge)
Subjective assessment, data profiling, and objective assessment are all directed at understanding the current state of the data--what the condition of the data is. Root cause analysis is performed to understand the reasons for data quality deficiencies--why defects exist. Corrective action is the step in which data and data manipulation processes are changed to remove existing defects and prevent future defects.
Data quality assessment is a multidimensional evaluation of the condition of data relative to any or all of the common definitions of quality: defect free, conforming to specifications, suited to purpose, and meeting customer expectations.
Subjective Assessment
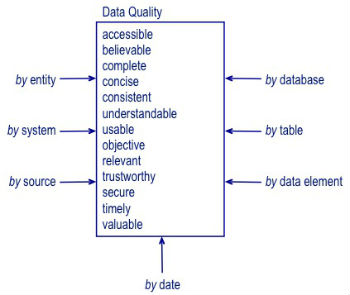
Subjective assessment seeks to understand and quantify perceptions of the people who work with data. This type of assessment fits well with quality definitions for purpose and expectations. Surveys are the most common method of subjective assessment--asking questions to measure the perceived degree of quality for criteria such as believability, usability, and relevance. A well-designed survey collects contextual data to view the results in multiple dimensions. Multidimensional analysis of data quality by variables such as entity, database, system, and source is valuable when planning the next steps. Figure 2 illustrates a multidimensional concept for subjective DQ assessment.
(Click to enlarge)
Data Profiling
Data profiling seeks to understand data by looking at data. Although looking at the data may seem obvious, it is often omitted when working to understand the data. The tendency to review data models, descriptions, definitions, and program code causes many to overlook the obvious. Those who do look at data often do so in an unstructured way that leads to seeing only what is expected. Data profiling overcomes the pitfalls of unstructured data review by systematically examining data to describe the realities found in it.
Data profiling tools extract real and reliable metadata by examining data at three levels. Column profiling examines the values of each column to collect information about frequencies, uniqueness, nulls, and so on. Table profiling studies associations among columns in a single table to identify data dependencies. Cross-table profiling finds associations among columns in multiple tables to identify relationships, redundancies, and dependencies. Tools extract and present data profiles. Human effort and subject expertise, however, are needed to analyze and understand the profiles.
Objective Assessment
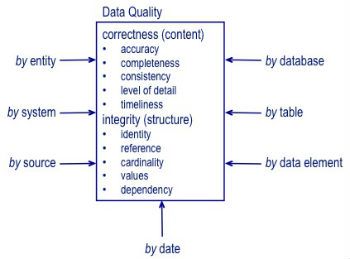
Objective assessment seeks to quantify specific and tangible characteristics of the data. Where subjective assessment focuses on what people say, objective assessment asks “What does the data say?” This assessment works well for quality definitions related to specifications and defects. Objective assessment tests data against data quality rules for criteria related to content correctness and structural integrity. As with subjective assessment, a multidimensional view of data quality measures is a valuable DQ management capability. Figure 3 illustrates a multidimensional concept for objective DQ assessment.
(Click to enlarge)
After Assessment
Once you understand the true state of data quality, you can take action to improve it. Begin with root cause analysis to understand why quality deficiencies occur and to achieve the lasting effects of fixing problems instead of symptoms. Then take two types of corrective action: data cleansing (to remove existing defects) and process changes (to prevent occurrence of future defects).
Now you’re ready to repeat the cycle. Assess subjectively to recognize how perceptions of quality have changed. Profile where quality is still perceived to be poor. Assess objectively to measure quality. Analyze causes, act to improve quality, and do it all over again.
Dave Wells is a consultant, teacher, and practitioner in information management with strong focus on practices to get maximum value from your data: data quality, data integration, and business intelligence..


Highlight of key findings from TDWI's wide variety of research
The Economy as a Generational Driver
Cost is an issue for almost everything in today’s economic recession, including the funding of data warehouse platforms.
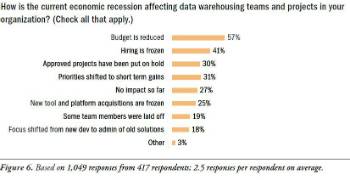
The recession has definitely affected BI and data warehousing. When asked how the current economic recession is affecting data warehousing teams, respondents reported reduced budgets (57%), frozen hiring (41%), projects on hold (30%), frozen tool and platform acquisitions (25%), and even layoffs (19%). (See Figure 6.) Only 27% said there’s no impact so far.
Source: Next Generation Data Warehouse Platforms (TDWI Best Practices Report, Q4 2009). Access the report here.


FlashPoint Rx prescribes a "Mistake to Avoid" for business intelligence and data warehousing professionals.
Mistake: Confusing Technical Architecture with Data Integration Architecture
By Larissa T. Moss
The difference between these architectures seems obvious, yet I run into agile developers who claim to be doing all the architectural work as part of their two- or four-week sprints. When I review their work, I usually see them designing the ETL process and determining the conformed facts and dimensions for a database that will support a specific BI application. ETL processes and database designs are technical architectures. In addition (and unfortunately), these ETL processes and databases are often not collectively architected for all of the BI applications across the entire organization, which results in inconsistent data and minimum data reusability.
Data integration architecture is a business architecture, and it goes far beyond conformed facts and dimensions in a database. It involves top-down, business-oriented, enterprise entity-relationship modeling (not database design) as well as bottom-up source data analysis to understand and document the business rules and policies about the data in the organization. A trained data administrator (not a technical database architect) facilitates the data integration sessions, which are attended by business people from many departments, including data stewards, power users, subject matter experts, and end users. In these sessions, synonyms (where a data element has multiple names), homonyms (where the same data name is assigned to multiple data elements), and dirty data are resolved; and the rules captured on the enterprise entityrelationship model are validated. Any data discrepancies or disputes among business people are also resolved.
Source: Ten Mistakes to Avoid In Agile Data Warehouse Projects (Q2 2009). Access the publication here.


