 View online: tdwi.org/flashpoint


July 7, 2011
ANNOUNCEMENTS
New Checklist Reports: Accelerating Data Integration and Fundamentals of Business Intelligence for the Small and Midsize Enterprise
CONTENTS

How to Achieve Far-From-
Average Performance with Predictive Analytics

The State of Operational
Data Integration: Growth of
the OpDI Practice

Mistake: Not Using a Three-
Step (EST) Approach

See what's
current in TDWI Education, Research, Webinars,
and Marketplace
How to Achieve Far-From-Average Performance with Predictive Analytics
Thomas A. “Tony” Rathburn
The Modeling Agency
Topic:
Predictive Analytics
Does anyone really want to be “normal”? When you were growing up, did you daydream about how great your future would be if you could just live your life as “normal”? Another dirty word is average. No one wants an “ordinary” or “average” résumé; we want to stand out, be different. We won’t settle for an “average” data warehouse, either.
In business, we develop and maintain many relationships. We have relationships with our customers, suppliers, and coworkers. We spend a great deal of time collecting information about those relationships, storing it, and analyzing it. We do so in the hope that, through effective analysis, we can discover key data points that will help us develop a strategy to enhance our business performance.
In this article, I’m asking you to consider that there is a basic flaw in the way most business people approach this effort. Many of us tend to treat our business relationships as coming from a single population.
Those of us who attempt to apply quantitative techniques to our analysis may start with what we have been taught--computations of the mean, standard deviation, and other descriptive metrics. From there, we may apply a variety of more sophisticated analysis techniques.
We hope to gain insights that will help us understand the dynamics of our relationships so we can modify our own behavior or that of the people with whom we interact. We want to understand why people behave the way they do, believing that if we have that understanding, we can then somehow be more effective in achieving our business objectives and higher levels of performance.
The Flaw: Human Behavior Is Not a Single Population
Consider an item from the physical systems world--water, for example. Whether we take a sample from the Pacific Ocean or our kitchen sink, our examination of water will yield only small variations in its properties. We determine that water boils, on average, at 212 degrees, though we also have to account for a variety of other factors such as the purity and salinity of the water. In the end, our formula describes how water behaves. Water is water. It comes from a single population. It behaves in a consistent and reliable manner, over time.
Human behavior, on the other hand, is inconsistent, unreliable, and varies over time. Human behavior is choice and may be heavily influenced by religion, upbringing, culture, family, prior experiences, and other factors. People tend to rely on habit rather than making unique choices in each situation.
This is fortunate, because this reliance on “behavior by habit” means that most of us are somewhat predictable in our behaviors. Additionally, this means that we have two aspects to consider: Will the behavior be displayed? And if it is displayed, what is the magnitude of the behavior?
The behaviors we monitor in our business relationships may either help us or hurt us relative to how we measure performance for our organization. Modeling human behavior also means that, at best, we get an expected probability that a group of people with a given set of characteristics will display a behavior at a particular rate.
Typically, we possess data about the people we have interacted with historically. Initially, let’s only consider the rate at which people display the behavior that is the focus of our analysis. In direct mail, for example, we may have a historical response rate of 2 percent. Out of the many possible metrics of success available, for this discussion we are going to measure our performance based on the response rate. Increasing the response rate helps us. Reducing the response rate hurts us.
Given a second group of people, with a different set of characteristics, we can determine the expected probability that the group will display a behavior that is of business interest to us. In our example, that group will have its own specific response rate. A sub-group of our current set of relationships may display that behavior at different expected probabilities and with differing levels of reliability.
Therefore, people and the behaviors they exhibit do not meet the standards of a single population. For every group we define, we can determine the “average” or “normal” rate at which they display the behavior we are interested in. We can also determine the magnitude at which the behavior is displayed.
The Solution: Resource Allocation
Consider that our analytics efforts would be much more effective in supporting our business objectives if we would explicitly define behaviors that have an impact on our performance; devote our energy to accurately defining the characteristics of groups that display these behaviors at different rates; and use this information to allocate our available resources to groups that give us the most benefit while minimizing our resource allocation to groups with a negative impact on performance.
This is the world of predictive analytics. Our concern isn’t with the “average” or “normal,” or with the “central tendency” of our historical relationships, other than as a point of reference. Our interest is in the tails of the distribution--the outliers. We are interested in defining the groups that display the behavior that impacts our performance in a consistent and reliable manner--at either a very high or very low level--so that we can adjust our resource allocation strategy appropriately.
From our direct mail example, we may be able to identify sub-groups (and their corresponding characteristics) in our historical data that have “normal” response rates that are dramatically different from the 2 percent response rate that is “normal” for our total population of relationships. Our traditional analysis would likely identify these people in the upper and lower tails of our distribution for the total population.
Predictive analytics cannot tell you what strategies to pursue, what your business objectives are, or how to measure success; those are the responsibility of your business managers. However, once those strategies and objectives are identified, and once the accompanying set of performance metrics are defined, predictive analytics can be very successful in helping you enhance your performance and deliver a significant ROI.
However, this approach enhances the stated business objectives and performance metrics. It gives you what you asked for, not what you “should” have asked for. When you change your performance metrics, predictive analytics analysis will often give you a slightly different set of definitions for your sub-groups, with a different resource allocation strategy. The analysis is custom and completely dependent on your specific performance metrics and the data relative to your relationships.
Finally, many business intelligence practitioners are concerned about “big data.” Predictive analytics is very good at dealing with the complexity of the large amounts of data we have available today, and with the many dimensions we can consider in constructing our groups. By combining the strength of predictive analytics in configuring these groups with the logic of resource allocation strategies inside the context of a solid set of business objectives and performance metrics--by allocating resources to groups that boost our performance and not to those that hurt performance--the ROI can be very significant.
Thomas A. “Tony” Rathburn is a senior consultant with The Modeling Agency and has over 25 years of predictive analytics development experience. Tony will present two new courses at the TDWI San Diego World Conference in August.


Highlight of key findings from TDWI's wide variety of research
The State of Operational Data Integration:
Growth of the OpDI Practice
One of TDWI Research’s positions concerning OpDI is that it is growing as a practice, and the growth can be defined different ways. For example, as discussed later in this report, OpDI is growing in capabilities and architectural design as organizations replace their hand-coded legacies with OpDI solutions built atop modern vendor tools. As another example of growth, OpDI is an increasing percentage of an organization’s overall workload for data integration, which is one of the main reasons organizations need to revisit resources they’re providing for OpDI.
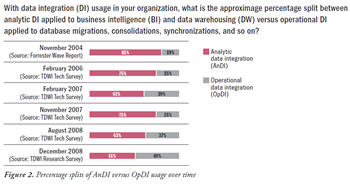
To quantify the state of the latter form of growth, this report’s survey asked: “With data integration (DI) usage in your organization, what is the approximate percentage split between analytic DI applied to business intelligence (BI) and data warehousing (DW) versus operational DI applied to database migrations, consolidations, synchronizations, and so on?” In fact, TDWI had asked this question four times before in Technology Surveys distributed at TDWI World Conferences. If we bring together the responses from all these surveys--plus a similar one this author conducted years ago at Forrester Research--a pattern emerges. (See Figure 2.)
Over time, the percentage split has shifted from 81% AnDI and 19% OpDI in 2004 to 51% AnDI and 49% OpDI in 2008. More simply put (and with numbers rounded), AnDI versus OpDI usage has progressed from an 80/20 split to a 50/50 split. This is a dramatic shift, given that it took only four years. Needless to say, this has been one of the most influential trends in data integration in recent memory--and it’s not over.
The surveys summarized in Figure 2 corroborate the anecdotal evidence TDWI Research has been hearing from data management professionals for years: resources are increasingly being diverted to OpDI as organizations are forced to upgrade legacy OpDI solutions or as organizations seize business and technology opportunities that succeed only when supported by excellence in OpDI.
(Click to enlarge)
Source: Operational Data Integration: A New Frontier for Data Management (TDWI Best Practices Report, Q2 2009). Click here to access the report.

FlashPoint Rx prescribes a "Mistake to Avoid" for business intelligence and data warehousing professionals.
Mistake:
Not Using a Three-Step (EST) Approach
By Dave Wells
Gathering requirements is a three-step process commonly called elicit, specify, and test (EST), but also known as elicit, model, test (EMT) and elicit, define, test (EDT). Regardless of the terminology, these three steps are important to recognize and apply.
Requirements elicitation involves obtaining from stakeholders the requirements for a developing system. “The most difficult part of requirements gathering is not documenting what the users ‘want;’ it is the effort of helping users figure out what they ‘need’ that can be successfully provided,” says Steve McConnell (Software Project Survival Guide, Microsoft Press). McConnell’s statement captures the essence of eliciting requirements--finding out what is needed.
Requirements specification (aka documentation or modeling) is the act of recording a description of each requirement. Every requirement describes a necessary system attribute--a capability or characteristic that the system must have in order to provide utility and value to its users. A well-specified requirement includes:
- WHAT A descriptive statement of the requirement that describes a system capability, characteristic, function, feature, or quality
- WHY The rationale for the requirement, describing the purpose or value to be achieved
- WHO The source of the requirement and the stakeholders who will receive benefit
Whether these are recorded as text (specify, document) or as diagrams (model), describing requirements is an important and separate step from eliciting requirements.
Requirements testing is the third and final step of the process. Each requirement must be evaluated to ensure that it is clear, unambiguous, complete, consistent, necessary, and feasible.
Source: Ten Mistakes to Avoid When Gathering BI Requirements (Q3 2008). Click here to access the publication.

