View online: tdwi.org/flashpoint


June 2, 2011
ANNOUNCEMENTS
New Checklist Report: Consolidating Data Warehousing on a Private Cloud
CONTENTS

A Simple, Low-Cost Technique for Automated Data Warehouse Testing

The Three Broad Practice
Areas of Data Integration

Mistake: Failing to Divide the Road Map into Smaller Modules or Phases

See what's
current in TDWI Education, Research, Webinars, and Marketplace
Business Requirements for BI
Dave Wells
Topic:
Business Requirements
Getting good business requirements is one of the really hard problems in BI. Real and meaningful requirements are elusive. Business stakeholders often don’t know what they need, can’t express needs in BI terms, and revert to describing requirements as reports. Requirements analysts also struggle with BI requirements. The questions and methods that work for more traditional information systems projects just don’t seem to work well for BI projects.
We need a different approach for BI requirements, but are mostly limited to the traditional techniques to elicit requirements--primarily, interviewing. To get good requirements, then, we need to change the interviewing process by asking different kinds of questions, and this article sets forth pragmatic questions that can help you capture real business requirements for BI.
Setting the Scope
Asking the right questions begins with context, which you can create prior to requirements interviews by identifying the management functions and motivations that frame a BI project. Figure 1 illustrates this concept. The management axis lists common business functions--the things that we manage. The motivation axis lists typical goals of management--the reasons that we manage. Tailor both lists to industry and organization specifics. Engaging BI stakeholders in refining these lists is a good first step in asking the right questions.
Within the structure of management and motivation, determine the kinds of business capabilities needed--inform, analyze, monitor, explore, predict, and so on. At the center of Figure 1 are common business capabilities that BI enables. Combining the three elements--management, motivation, and capabilities--creates clear and meaningful statements about the scope of a BI project, such as “monitor sales growth.”
(Click to enlarge) After setting contextual scope, you can conduct a different kind of interview. Often the hard part of eliciting requirements is asking questions that shift thought processes from reporting-oriented views of information. The interviewer must ask new kinds of questions so the interviewee thinks about information delivery in different ways. Ultimately, we need to identify the BI products (e.g., reports, queries, scorecards, dashboards) that must be built. Getting to these products involves asking several kinds of questions: big picture, personalization, current state, and future state. Big-Picture Questions Making It Personal Current State of Data and Analysis Current State of Reporting Future State You need to ask about the work of an individual or group and translate the responses into needs for business capabilities. Questions such as those listed below readily translate to business capabilities. Product Requirements (Click to enlarge) A BI project will likely produce more than one product--for example, several products of the same type, such as many different scorecards. Different product kinds are also likely to be needed--a combination of dashboards and scorecards, for example. When working with multiple products, consider how they are related. Common relationships among BI products include: Beyond Business Requirements Dave Wells is a consultant, teacher, and practitioner in information management with strong focus on practices to get maximum value from your data: data quality, data integration, and business intelligence. A Simple, Low-Cost Technique for Joe Frantz Topic:
Extract, Transform, and Load
The approach is a black-box technique that verifies ETL (extract, transform, and load) accuracy by examining results and compares them to specifications. Although it has evolved over multiple projects using a specific multi-tiered architecture, the idea can be applied to any ETL application. No additional software is needed beyond a database management system and a spreadsheet program. A graphical SQL editor is helpful but not absolutely necessary. Most important, this technique leverages the business rules, standards, mappings, test plans, and journeyman SQL skills that are already part of a well-structured data warehouse program.
The process starts with simple, well-structured mappings, and transformation rules. In this case, the data architect exports his mappings from the entity relationship diagram (ERD) tool to a spreadsheet. Mapping spreadsheets can be created manually, but the export provides a nice link back to the models. Each spreadsheet row identifies a source table and column, a target table and column, and a column-level transformation rule written in a standard syntax. A test case is defined for each ETL rule and given a unique identifier.
The simplest example is a source-to-target move with no transformation. This rule is coded by the architect as “move” in the transformation rule column. Its test case calls for comparing source and target values for equality. Another rule, coded as “list,” calls for a table lookup to ensure that column contents are in a table of valid values.
We’ve implemented six simple rules in this fashion, and none is more complex than these two examples. Once complete, the maps are turned over to the ETL developers and uploaded to a database table that drives the automated test process.
For each rule, a stored procedure is written to generate queries that apply the rule’s test case. A test query is generated for each source, target, and rule combination in the mapping table. The body of the query is created using escape coding (select ‘Select…’) with specific source and target columns substituted from the mapping table.
The generated queries are stored for later execution by a second procedure that allows filtering of the test data population by time periods, column groupings, and sampling rate. After execution, test results are stored with their respective test case and test cycle identifiers, and developers are given detailed defect reports containing source and target data values and specific row identifiers for each rule violation.
Given the simplicity of the tests, the number of defects uncovered is always surprising. This is where the automation comes into play. It allows for up to 100 percent examination of very large test data sets, and it detects many low-frequency errors that would otherwise be discovered post production or cause anomalies in downstream usage. Test cycle times are also dramatically shorter, allowing many more detection/correction cycles in a given time period. In short, more thorough testing of the basic ETL processes in less time frees up the QA analysts to focus on the complex items with traditional methods.
There are also some less measurable benefits:
This technique has evolved over the course of four or five projects to date and is still a work in progress. It obviously doesn’t cover all testing requirements, and stepping up to more complex testing or functionality probably means looking into commercial options. However, if you don’t have access to the more expensive options, this is a very cost-effective way to benefit from automated testing, either as an initial step or when a simple approach is sufficient. Joe Frantz has been a consultant and manager in business intelligence and data warehousing for over 15 years. His industry experience includes insurance, healthcare, pharmaceuticals, energy, banking, mining, and entertainment. Joe is part of CONNECT’s Knowledge Network and has implemented this testing approach in multiple environments.
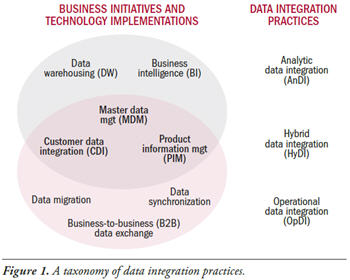
The Three Broad Practice Areas of Data Integration (Click to enlarge) Source:
Operational Data Integration: A New Frontier for Data Management (TDWI Best Practices Report, Q2 2009). Click here to access the report. Mistake:
Failing to Divide the Road Map into Smaller Modules or Phases
Road maps that include many components (data modeling, a data warehouse with many sources, ETL, business intelligence reporting, product acquisition or changes, database platform changes, or business process management) can take years to complete. Business and IT owners typically prefer to see results within a few months. Dividing the road map into modules or phases, prioritizing them, and understanding their interdependency allows for an iterative delivery schedule. Create a dependency grid to help you visualize the order in which to implement the modules and to determine whether there is sufficient flexibility to change that order as business priorities change. For example, consider an organization that did not have its transactional data feed processes automated, scheduled, or implemented with exception handling. Incorporating these features into the data feed was module one and priority one. Every other module for building a data warehouse and BI was dependent on this module and thus could not have a higher priority. This organization considered implementing a business process management tool, which was considered a “nice-to-have” product without any dependencies. It could be added when and if time and money allowed. Source:
Ten Mistakes to Avoid When Creating a Business Intelligence Road Map (Q2 2008). Click here to access the publication.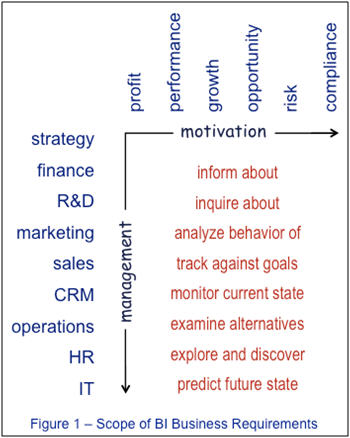
These are “surveying the landscape” questions that help both interviewer and interviewee get into the right frame of mind to explore and describe real BI requirements. Breaking away from “just another report” thinking means that you need to step back far enough to view information within the context of how it is used.
These are introspective questions for individuals. Getting each person to “see themselves” in BI can dig out real requirements. Use these questions to start the conversation about a personal view of business, information, and BI.
This set of questions about spreadsheet use is an effective way to discover how people work with information and perform analysis. Excel is a good indicator of how individuals meet their own information needs. You’ll get different responses if you ask “How do you use Excel?” instead of examining how recent files are used. Begin with the recent files list, and extend your conversation to other uses. Some questions to apply this approach are:
Eventually you’ll need to explore existing reports to elicit BI requirements. Examine existing reports to understand what they represent as information and analysis needs--not to simply replicate the reports with different technology. Good reporting questions include:
Future state returns to the question of capabilities. Ultimately, the requirements-gathering process needs to identify needs for capabilities at a deeper level than the scope setting. However, it doesn’t work to ask, “What capabilities do you need?” Nor can you find these requirements by providing a list--inform, inquire, analyze, track, monitor, examine, explore, predict--as if it is a restaurant menu.
Business requirements for BI should detail the things you’ll build to deliver capabilities--the BI products to be produced. The table below illustrates common mapping of business capabilities to BI products. Choosing the right product depends on understanding who will use the product and for what purpose.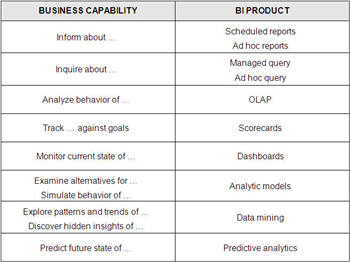
Requirements gathering that leads to identifying BI products will help you define functional requirements for each product. Once you know what you need to build, defining functional and technical BI requirements becomes much easier.
Automated Data Warehouse Testing
CONNECT: The Knowledge Network
Tools exist for all aspects of data warehousing and business intelligence. However, just because they’re available does not mean that we have access or funding to implement them. Having experienced this situation several times, we have developed a simple but effective approach for realizing some of the benefits of automated testing when commercial tools are not an option.

Highlight of key findings from TDWI's wide variety of research
TDWI’s position is that diverse data integration practices are distinguished by the larger technical projects or business initiatives they support. So, this report defines data integration practices by their associated projects and initiatives. Figure 1 summarizes these projects, initiatives, and practices (plus relationships among them) in a visual taxonomy. There are three broad practice areas for data integration:

FlashPoint Rx prescribes a "Mistake to Avoid" for business intelligence and data warehousing professionals.
By Mary Beth Kush