


April 7, 2011
ANNOUNCEMENTS
Submissions for the next Business Intelligence Journal are due May 20. Submission guidelines
New Best Practices Report: Next Generation Data Integration
CONTENTS

An Introduction to BI
Lifecycle Management
The Key to Accurate
BI/DW Project Estimates

Architectural Approaches to Spreadmarts

Mistake: Migrating or Consolidating When You Should Be Collocating or Integrating

See what's
current in TDWI Education, Research, Webinars, and Marketplace
An Introduction to BI
Lifecycle Management
Steve Dine
Datasource Consulting, LLC
Topic:
BI Lifecycle Management
It’s no secret that business intelligence (BI)1 projects are time and resource intensive, often suffer from poor communication between the business and IT, and are usually inflexible to changes once development has started. This is due in large part to the method in which BI projects are traditionally implemented.
Regardless of the project management methodology you employ, a successful BI iteration requires business requirements identification, data analysis, data architecture and modeling, data integration (e.g., ETL, ELT, data virtualization), front-end development, testing, and release management--at the least. Whether you choose to integrate testing with development or employ prototypes and sprints, it doesn’t change the fact that design, development, and testing are part of the process.
The problem with the traditional implementation of BI projects is that the design and development steps across the architecture aren’t integrated and insulated from direct input by the business. In addition, because the tools usually employed for design and development aren’t integrated, both initial development and subsequent changes require a significant level of manual effort and change management. If we want to improve the traditional BI development process, we need to approach this process as a business-driven lifecycle and integrate and automate as much of the development process as possible.
BI lifecycle management is a design, development, and management approach to BI that incorporates business users into the design process by generating data models, database objects, data integration mappings, and front-end semantic layers based on input from business users. The challenge is that traditional BI projects leverage multiple, disparate tools used throughout the BI architecture to capture requirements; document business rules; perform source system analysis; model the data warehouse; and transform, store, report, and analyze the target data. In many environments, metadata management applications, data quality tools, and advanced analytic applications are also employed. Rarely do these tools share metadata, which makes it challenging to automate development and difficult to determine the impact when changes are required. In addition, business input is indirect because it must be captured, disseminated, and often recommunicated to the development team.
Fortunately, a number of BI lifecycle management tools can facilitate this approach. With these tools, users are able to input project requirements, logical entities, relationships, business rules, source attributes, target attributes, and business metadata. These elements are inputs to the logical model, which can be defined and then reviewed by the business. Once approved, a physical model is generated from the logical model, the database objects are generated automatically from the physical model, and the data integration (i.e., ETL/ELT/SOA) mappings are created, along with the objects in the persistence layer. (See Figure 1.) Some tools also generate the semantic models for front-end tool sets from the metadata captured during logical data modeling. Each step in the process is reviewable by the business and IT through a workflow process, and dependencies ensure that a change is reflected across the architecture.
(Click to enlarge)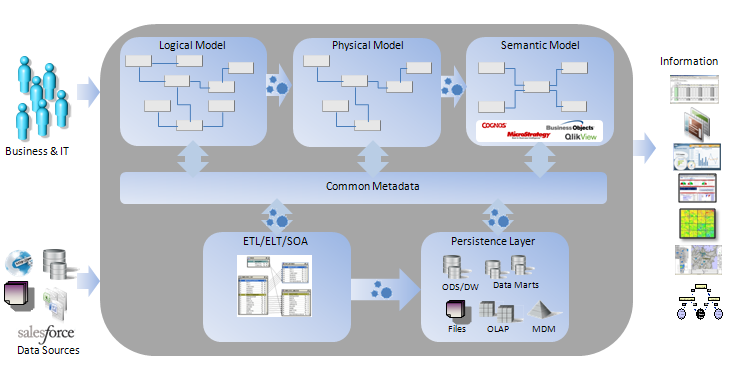
The consistency between layers of the architecture is provided by the common metadata layer. Consider it an inventory of BI architecture assets with defined relationships. Because all the attributes, business rules, physical objects, and other elements are being captured, the dependencies can be identified and traced. This enables change-impact analysis and facilitates the testing process. The common metadata layer also creates a linkage between all the layers of the architecture so that each layer can be generated dynamically for rapid prototyping, which provides context to users throughout a BI implementation.
If a change is required to one entity in your logical model (in yellow, Figure 2), you can also see what objects would require changes across the entire architecture. In addition, with workflow and version management, changes can be controlled, tracked, prototyped, implemented, and rolled back if necessary. You could also view changes to the entire environment over time. Workflow automation ensures that the changes are approved at each step along the way.
(Click to enlarge)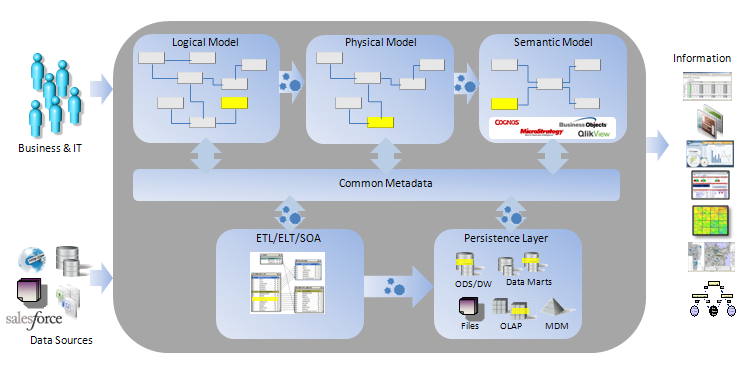
The business community has long complained that BI takes too long, is too IT focused, and doesn’t respond easily to change. If BI is to become more agile, we must approach the implementation process as an integrated lifecycle rather than loosely connected steps. Although most BI lifecycle tools are still immature (i.e., they only address a few areas of the complete process), they provide a glimpse into what’s possible.
However, you don’t need to purchase a BI lifecycle tool to get started. BI projects and programs can incrementally add BI lifecycle capabilities into their processes using existing tools. For example, many ETL applications support mapping definitions that can be generated from Excel spreadsheet templates, which can be populated by a data modeling tool. Although this doesn’t address the entire lifecycle, it does help you view the design and development process as a business-driven, integrated lifecycle, and begin to change the way you implement BI.
In my next TDWI FlashPoint article, I’ll discuss the steps in the BI lifecycle process in more detail and explain how you can integrate these steps across both the design and development of the BI architecture.
1 Note: In this context, BI refers to both the data integration layer as well as the front-end tools for reporting, analyzing, and disseminating the information. [Back to top]
Steve Dine is the managing partner at Datasource Consulting, LLC. He has extensive hands-on experience delivering and managing successful, highly scalable, and maintainable data integration and business intelligence solutions. Steve is a faculty member at TDWI and a judge for the TDWI Best Practices Awards. Follow Steve on Twitter: @steve_dine.

The Key to Accurate BI/DW Project Estimates
Patty Haines
Chimney Rock Information Solutions
Topic:
BI/DW Project Planning
Your organization has approved a business intelligence/data warehouse (BI/DW) initiative and is requesting resource, time, and budget estimates. Key success factors for this project are to stay within budget and deliver on time. With so many unknowns, it can be difficult to make accurate estimates. Here are some tips to improve estimates and project success:
1. Use a proven methodology. Select a development methodology that has been proven successful in the design, development, and implementation of a BI/DW environment. Following the methodology’s steps in their specified order will help you efficiently plan for the special needs of a BI/DW project. If you need flexibility, consider a methodology that emphasizes the hub-and-spoke architecture. If you need to implement quickly, choose a methodology that emphasizes the bus architecture. The selected methodology should also fit within your organizational structure, culture, and required processes for IS projects.
2. Complete the project in increments. Another key to successful BI/DW project estimation is to break the project into small, manageable pieces. This keeps the focus on fewer subjects at a time and delivers ongoing value to the business community as the project team moves through each increment.
A good approach is to define the first increment as the “infrastructure increment.” Plan on achieving these tasks in this increment:
- Determine the high-level architecture of the BI/DW environment
- Determine data flow from source to target data stores
- Implement software that will be used to build and maintain the BI/DW environment, including data profiling, metadata, DBMS, data modeling, ETL, job scheduling, sorting, query, and dashboard tools
- Implement hardware, including new servers and additional disk space
- Develop and implement procedures and processes for the BI/DW increments, such as how each sub-team will work together, turnover and approval processes, change control, and communications within and outside the project team
- Create the project plan, with risks and mitigation factors, for the second increment
The second increment can now be the first set of data--one or two key subject areas that will provide value to the business community. This first set of data might be reference data--such as customer, product, service, and account--so that when the business data is brought into the data warehouse, it can be tied to this foundation data.
3. Use experienced team members. Select people who are experienced in BI/DW projects. There are numerous differences between a BI/DW project and an OLTP operational system, which makes it critical to work with experienced BI/DW staff when providing estimates and performing project tasks.
Each project area will have specific knowledge needed for:
- Project planning: to work with a BI/DW methodology
- Architecture: to determine the architecture and data flow for the BI/DW environment
- Requirements gathering: to identify questions, information needs, and access requirements
- Data profiling: to identify source domains, issues, and navigation requirements
- Data design of numerous types of data stores (e.g., normalized, dimensional, denormalized, flattened), considering both raw and cleansed data
- ETL developers: to determine standard processing requirements, including changed data capture (CDC), surrogate keys, dates, error handling, and restart processes
- User interface: to determine and implement a query tool, understanding how the business community wants to see and work with the data in an ad hoc environment
- Canned reports and dashboards: to identify what and how data should be presented or accessed by the business community
- Testing: to determine how best to test each type of data store
4. Complete a source analysis. Another important step is to work with the IS support staff to understand the source data structures. For a more accurate estimate of work effort, it is critical that you have detailed knowledge of the sources so you can understand the data elements and complexity of pulling and moving source data to a target data store, including:
- Navigation rules: to understand how to link through the data structures
- Update and refresh dates: to identify last update and create dates (how and when they are populated by the source programs)
- Multiple-use fields: to identify data elements used for more than one purpose based on other pieces of data
- Stability: to understand how often the data structures change and how that change occurs
- Major enhancements: to identify if and when major enhancements are planned for the source data structures
- Physical deletes: to determine if deletes are physical or soft (with an indicator the record has been deleted)
- Data changes: to determine if data is changed with processes outside the operational system (such as correcting a piece of data through DBA privileges)
- Known data issues: to understand some of the challenges the team will encounter while defining target data stores and moving data from source to target data stores
5. Profile the data. Evaluating and understanding the data when estimating project tasks and work effort is another key to better estimates. The more you understand about the data values, the better your definition of the tasks required. It also translates to more efficient code design and development, and usually fewer defects and less rework.
Data profiling includes analyzing the actual data values for each data element that will be a source for the data warehouse. This includes:
- Value frequency distribution
- Maximum and minimum values
- Null and zero values
- Actual values (compared to the valid set of values)
- Values that don’t make sense for the data element
Too many times, the project team is asked to move forward with the project as soon as possible--to pull together estimates with little knowledge of what they are trying to build, how they will build it, and the complexity of the project. A more structured planning and analysis approach using a proven methodology will result in better definition of the project and better estimates for resources, time, and budget.
Patty Haines is founder of Chimney Rock Information Solutions, a company specializing in data warehousing and data quality. She can be reached at 303.697.7740.

Highlight of key findings from TDWI's wide variety of research
Architectural Approaches to Spreadmarts
Some experts claim that power users use BI tools mainly as a personalized extract tool to dump data into Excel, where they perform their real work. According to our survey, that’s not the case. Only a small percentage (7%) of spreadmarts obtain data this way. More than half of spreadmarts (51%) use manual data entry or manual data import. (See Figure 8.) It follows that a major way to drain the life out of spreadmarts is to begin collecting the data they use in a data warehouse and create standard reports that run against that data. Of course, if there are no operational systems capturing this data, then a spreadmart is the only alternative.
(Click to enlarge)
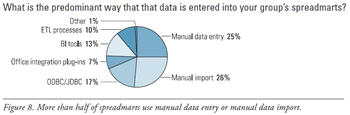
Source: Strategies for Managing Spreadmarts: Migrating to a Managed BI Environment (TDWI Best Practices Report, Q1 2008). Click here to access the report.

FlashPoint Rx prescribes a "Mistake to Avoid" for business intelligence and data warehousing professionals.
Mistake:
Migrating or Consolidating When You Should Be Collocating or Integrating
By Philip Russom
The upside of data migration and consolidation is that they are immediate fixes that can add value to data, despite high risk due to high intrusion. The downside is that they are fatally disruptive, in that they kill off the migrated and consolidated systems. These projects migrate people and business processes, not just data and applications. Hence, system owners, sponsors, and users may resist.
For these and other reasons, data migration or consolidation may not be desirable or feasible. That’s okay, though, because you can achieve similar results from other approaches:
Database collocation. Move databases created with the same DBMS brand to a central location and manage them with a single DBMS instance. Note that each database retains its original data model, whereas true consolidation would merge them into a single data model. Collocation is cheap, fast, and relatively nonintrusive. Plus, it can reduce administrative costs, but it adds little or no visible value to data and business processes.
Data integration. Leave data and its established platform in place and then connect these to other systems via data integration tools, or use replication to synchronize whole databases or selected tables within them. This improves data content tremendously in a nonintrusive way but suffers high initial costs (especially when you first put in integration infrastructure) and administrative costs over time (because you must maintain the infrastructure).
Source: Ten Mistakes to Avoid When Migrating Databases (Q4 2008). Click here to access the publication.

