


March 3, 2011
ANNOUNCEMENTS
TDWI Members receive a $275 discount on TDWI World Conferences. Register for the the upcoming TDWI World Conference in Washington, D.C., April 3–8, here.
CONTENTS

Visual Reporting and Analysis: Seeing Is Knowing
Teasing out the Need for
Master Data Management

Spreadmarts’ Benefits and Liabilities

Mistake: Not Layering Business, Functional, and Technical Requirements

See what's
current in TDWI Education, Research, Webinars, and Marketplace
Visual Reporting and Analysis:
Seeing Is Knowing
Mark Hammond
Topic:
Data Visualization
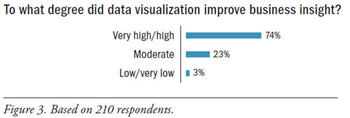
It’s conventional BI wisdom that data visualization is a good thing. Data that is visually rendered in charts, graphs, and maps helps users spot outliers and detect trends. Typically showcased in a dashboard, data visualization can prompt a user to drill down to underlying detail for exploratory analysis.
The question is: Exactly how valuable is data visualization in BI environments? TDWI endeavored to quantify that in a recent Web survey of BI users and technologists, and reported the results in a new Best Practices Report, Visual Reporting and Analysis: Seeing Is Knowing. These two bar charts sum it up:
(Click to enlarge)
(Click to enlarge)
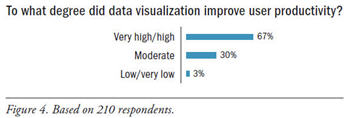
These are strong results, and they were corroborated in our research interviews with more than a dozen BI users and managers, dashboard architects, and visualization vendor representatives. Nearly all of our user interviewees were decidedly enthusiastic about how data visualization is contributing to business insights and productivity. Daniel Gerena, director of BI and analytics at Kaleida Health, a healthcare provider near Buffalo, New York, summed it up this way:
“Our dashboards are really changing the culture to an analytically driven one. They’re changing a lot of behavior in how people manage. They’re helping people do their jobs better, both on a daily basis and from a strategic perspective.”
Some other data points from the study:
- Among survey respondents, 56 percent of dashboards were deployed only within the past year
- Bar and line charts are the most prevalent visualizations in use and are rated as delivering the highest value
- Data visualization is most important in dashboards (85 percent of respondents) and less important in Excel (37 percent of respondents)
- Managers are the most frequent users of dashboards (86 percent), followed by executives (77 percent)
- Only 15 percent of dashboards are used “very heavily” (that is, at least once a day)
- Data visualization is most important in time-series analysis (71 percent), comparing categories (59 percent), and detecting outliers (59 percent)
Text and Numbers Are Still King
Now here’s a kicker: despite the growing usage of data visualization, BI users view data in tables of numbers and text (reports and spreadsheets) 65 percent of the time, versus 35 percent of the time in visual charts and graphs. The reasons are twofold.
First, data visualization is in its early phases--as noted above, 56 percent of our respondents’ dashboards were rolled out in the past year. Second, reports and spreadsheets make sense in many data analysis tasks, especially with smaller data sets or summarized data that communicates a few key points.
TDWI expects the gap to narrow, if not reverse itself, as more dashboards are deployed and data visualization becomes a commodity, embedded in more of the business applications that people use routinely. As our research found, visualization is on the rise in the enterprise and in the public realm.
For instance, NYTimes.com, WSJ.com, Google, and Yahoo! are among the dozens that have introduced new data visualization capabilities within just the past year. The visualization landscape at large is growing rapidly--partly because it helps us, as a society, to come to grips with the ceaseless information onslaught that we face every day. A good example is a tree map called “The Billon Dollar Gram” by the “data journalist” David McCandless.
In the enterprise, most data visualization is of the relatively basic “visual reporting” flavor, which is more static, versus the richer “visual analysis,” which is more interactive and can feature ad hoc query, forecasting, and statistical analysis, among other features. The latter is gaining ground, however, thanks to such technology as in-memory processing, hardware performance improvements, Web 2.0/3.0 interactivity.
Judy Doherty, director of Information Management Systems at Dartmouth College, told us “It’s the combination of data discovery in a visual environment that makes it so powerful.” She noted that, ironically, the raw data that drives insights in a visual environment has usually been available all along, in data warehouses, BI reports, transactional systems, and more. “I’ll often hear, ‘Why didn’t we have this data before?’ In fact, they did have it, in a report--they just didn’t see it.”
Mark Hammond is a veteran contributor to TDWI, including a number of research reports, Business Intelligence Journal, What Works, and more.
Download a copy of TDWI’s Best Practices Report, Visual Reporting and Analysis: Seeing Is Knowing, here. For guidance on dashboard development and usage, see Wayne Eckerson’s book, Performance Dashboards: Measuring, Monitoring, and Managing Your Business, second edition (John Wiley & Sons, 2010).

Teasing out the Need for Master Data Management
Jill Dyche
Baseline Consulting
Topic:
Master Data Management
A few years ago, when marketing executives claimed their data wasn’t ready to support targeted marketing, everyone nodded sympathetically. It was hard. No one knew for sure where to start. Customer data needed to be cleaned up and reconciled. IT was busy.
Nowadays, those head-nodders are more likely to put their hands on their hips, thrust their heads back, and ask, “Well, if not today, then when?” Add executives in finance, sales, operations, and strategic planning to those with data integration and governance challenges, and marketing suddenly finds it has plenty of company.
On the eve of TDWI’s Master Data, Quality, and Governance Solution Summit, I thought I’d share a few recent conversations I’ve had with executives who are confronting the need to manage their companies’ master data. These conversations were surprisingly candid and refreshingly devoid of excuses. They manifest a cultural impatience with data quality and an awareness of its sometimes dire consequences. Any of these ring a bell?
- “Our executives have talked about quantifying customer value for a dozen years now. They’ve read about the other banks doing it. We know these other banks’ secret: they’re doing it with duplicate customer records. If I don’t know that three customer records are really the same person, then I’m not accurately calculating that customer’s true value. Honestly, if we don’t apply MDM to this problem, we may as well give up customer value altogether and use that ‘strategy of nice’ that everyone falls back on.”
- “I know other CPG firms have this problem, but having different prices for the same product is embarrassing. I’m not talking about anything sophisticated like value-based pricing here. I’m talking about having 13 different product catalogs that contain not only different product prices but different size, weight, and dimension details. Now some folks in yet another line of business are thinking about building their own product catalog and I’m trying to convince them not to. I mean, we already have 13--can’t they use one of those?”
- “We’ve stopped using the term ‘single version of the truth’ around here. Nowadays that phrase just falls flat. The sad fact is that we have multiple versions of the single version of the truth. I’m not sure what’s funnier here, the concept of a ’single version’ of something or the concept of truth. There is definitely no truth. So now let’s talk about our ability to have an informed negotiation with one of our suppliers. We can’t do it, full stop.”
- “We’re like any other healthcare provider, except that we’re a children’s hospital, which means our patients are little kids that have cancer and heart problems and other bad stuff. With a mission like ours you’d think that reconciling patient data across service lines would be pretty critical--and everyone insists it is--but no one knows exactly what the answer is, so we’re moving slowly. Too slowly. Someday really soon something bad is going to happen because we didn’t individualize a patient quickly enough. Am I making my point?”
- “We need to change the way we do things internally. We need to go from gut-feel instinct to scientific, rigorous decision making. We don’t know why we’re putting what we’re putting on our Web sites. Our lines of business accuse us of flawed research, but they can’t tell us why. We don’t know what customers they have in common. In short, we don’t know which ads are working, and we don’t know who to market and sell to. Ultimately, this is going to damage our brand.”
Savvy data practitioners can parse these conversations into actual MDM requirements--if not outright business cases. The trick is to illustrate the path between business pain point and the right set of solutions. An MDM hub is merely one component of many.
In our book, Customer Data Integration: Reaching a Single Version of the Truth (John Wiley & Sons, 2006), Evan and I talk about narrowing executive focus to specific business needs that mandate MDM. We present a series of industry-specific business needs. We also discuss the business’s varying needs for data access as illustrated in Figure 1.
(Click to enlarge)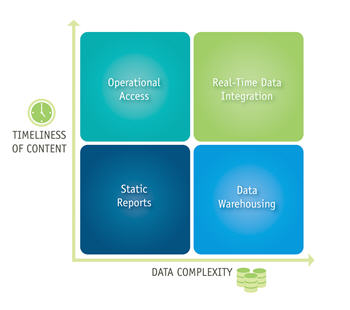
We explain that while data warehouses have long been the de facto solution for integrating data for analytics and reporting, MDM tackles a different problem set. MDM is less an end user–focused solution and more of an active data provisioning mechanism to various operational applications. Need both? First, know what you have (hint: see Static Reports, above). Document business requirements and build some use cases. Understand how much specialized development you’ll need to do, and whether you have the chops. Present the playbook back to executives, then talk to some data integration vendors.
The extent to which executives who will be funding data governance and MDM efforts “get” how they propel the organization forward--with all due respect to our incumbent systems--is the extent to which data integration will get traction. Better late than never.
Jill Dyche is a partner and cofounder of Baseline Consulting. She is the author of three acclaimed business books, and her popular blog, Inside the Biz, focuses on the business value of IT. Jill is the co-chair of TDWI’s Master Data, Quality, and Governance Solution Summit.

Highlight of key findings from TDWI's wide variety of research
Spreadmarts’ Benefits and Liabilities
Given the results just described, it should be no surprise that survey respondents said that spreadmarts have had both positive and negative impacts on their organizations. A majority (61%) of our survey respondents said that spreadmarts have had “some bad and some good” impacts. Among the remaining, about a quarter (24%) think that spreadmarts are mostly or entirely bad, while a smaller percentage (15%) believe they are mostly or entirely good. (See Figure 7.)
(Click to enlarge)
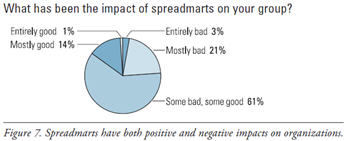
Source: Strategies for Managing Spreadmarts: Migrating to a Managed BI Environment (TDWI Best Practices Report, Q1 2008). Click here to access the report.

FlashPoint Rx prescribes a "Mistake to Avoid" for business intelligence and data warehousing professionals.
Mistake:
Not Layering Business, Functional, and Technical Requirements
By Dave Wells
Specifying requirements at three levels--business, functional, and technical--provides a logical progression from what the business needs to what a system does. Every requirements-gathering process should begin with business requirements, define functional requirements, and end by defining technical requirements. Functional requirements are driven from business requirements; technical requirements are driven from both business and functional requirements.
Business requirements itemize the needs and goals the business and the stakeholders have for a system. These include requirements for system interface and interaction, processing, data, information, and delivery of data and information. User requirements are an important aspect of business requirements. User requirements address topics such as ease of use, speed, accessibility, and mobility.
Functional requirements describe all of the inputs and outputs of a system and identify the specific transformations and data manipulations that must be performed to get from input to output. These requirements encompass the entire data-to-information pipeline from received input data to delivered information. They describe the flow of data and information through that pipeline. Functional requirements are derived from business requirements.
Technical requirements (also known as nonfunctional requirements) describe specific qualities that a system must have, such as performance, security, availability, reliability, quality, scalability, and maintainability. Technical requirements specify how well the system must perform the functional requirements. They are the system-specific, service-level requirements from which service-level agreements are derived.
Source: Ten Mistakes to Avoid When Gathering BI Requirements (Q3 2008). Click here to access the publication.

