 View online: tdwi.org/flashpoint


September 6, 2012
ANNOUNCEMENTS
NEW TDWI Checklist Report:
Seven Reasons Why Master Data Management Needs Data Governance
CONTENTS

Classic Data Architectures Revisited
Data Virtualization: Adding to the Data Integration Toolbox

The Requirements for Being an Analytics-Based Organization


Mistake: Confusing the Prerequisite with the Payoff

See what's
current in TDWI Education, Events, Webinars,
and Marketplace
Classic Data Architectures Revisited
Chris Adamson
Oakton Software LLC
Topic:
Data Warehousing
BI professionals use shorthand to distinguish two data architecture paradigms: hub and spoke and bus. These labels are useful, but don’t assume they are mutually exclusive. Even for traditionalists, data architectures are likely to share both characteristics.
The Paradigms
The term hub and spoke is used to characterize W.H. Inmon’s data warehouse architecture. This architecture features a division of labor between two types of data stores. A central repository, the “hub,” serves the purpose of integration. In turn, this repository feeds several subject-oriented data marts--the “spokes.” They are intended for user access.
The term bus is used to characterize Ralph Kimball’s data warehouse architecture. This architecture does not require separate data stores for integration versus access. Subject-area data marts may be distributed across databases or stored centrally. They share a set of common definitions for key reference data across data marts. These rules are called the conformance bus.
Deconstructing the Labels
The labels hub and spoke and bus are useful in distinguishing these approaches because they describe their salient characteristics. However, don’t assume they both describe physical architectures.
- Hub and spoke describes the physical distribution of data that characterizes Inmon’s approach.
- Conformance bus describes the semantic consistency of data that characterizes Kimball’s approach.
It is possible to have both a conformance bus and hub-and-spoke distribution in both architectures.
Hub and Spoke … and Kimball
Following Kimball’s approach, data elements that appear in multiple data marts (such as products or customers) are defined, designed, and mapped to operational data once and only once. This single set of design rules is called the conformance bus. Semantically, they are always represented consistently.
A conformance bus does not preclude a physical hub. For organizations that are building distributed data marts, the easiest way to ensure semantic consistency is simple: use a hub-and-spoke architecture. Standard sets of conformed data structures are populated once, in a central repository, and in turn replicated to distributed data marts.
Although not required by Kimball’s architecture, this approach is not inconsistent with it. When organized in this manner, the result is conceptually similar to Inmon’s architecture.
A Bus for Inmon’s Spokes
Following Inmon’s approach, hub-and-spoke distribution of data is a given. Again, this does not mean the other label does not apply. Across the various data marts, a semantic bus ensures consistency and compatibility.
Without a conformance bus, data marts may provide conflicting information or exhibit incompatibilities. For example, lacking a common definition of a customer, it may be impossible to compare proposal information contained in a marketing data mart with order information contained in a sales data mart. The business is unable to report a close rate across customer characteristics unless we build a third data mart to perform the cross reference.
More Similar than Different
Hub-and-spoke distribution of data does not preclude a semantic bus, nor does a semantic bus preclude hub-and-spoke distribution of data. Seen in this light, the two architectural paradigms have more similarities than you might otherwise assume. There are other similarities as well. Both call for an integrated view of information and the capture of granular data. Both present information to business people through data marts.
In fact, there is only one real and consistent difference between the two approaches. For Inmon, the central repository is designed using principles of entity-relationship modeling; the data marts are designed according to the principles of dimensional modeling. For Kimball, all data stores are designed using the principles of dimensional modeling.
Chris Adamson provides strategy and design services through his company, Oakton Software LLC. For more on managing your data architecture, see his latest book, Star Schema: The Complete Reference (McGraw-Hill, 2010).

Data Virtualization: Adding to
the Data Integration Toolbox
Dave Wells
Topic:
Data Management
Data virtualization is the most recent--and in many ways the most powerful--tool in a data integrator’s toolkit. Virtualization presents data as an abstract layer fully independent from the structures, systems, databases, and storage technologies used to manage source data. Data virtualization isn’t new; it has been around for years with the label enterprise information integration (EII). Now, it has finally come of age: properly named, with mature technology, and available both as standalone platforms and embedded in analytic appliances and BI tools.
What Is Data Virtualization?
Rick van der Lans defines data virtualization as “the process of offering data consumers a data access interface that hides the technical aspects of stored data, such as location, storage structure, API, access language, and storage technology.” Important data virtualization concepts described here are virtualization as a process, consumer focus, and hidden technology.
Consumers, both human and software, access the data they require without needing to understand the underlying data structures and technologies. Core functions of the virtualization process--abstraction, decoupling, and mapping--make this possible. Abstraction describes the data in business terms instead of database terms. Decoupling separates abstract views from physical views. Mapping provides the linkage between abstract and physical views of data.
Why Data Virtualization?
The benefits of data virtualization are many, and they include both business and technical value. The business case for data virtualization is based on business dependency on data. Data virtualization enables business agility, action ability, information speed, and information quality with:
- Rapid data integration, resulting in quicker time to solution for business information needs
- More information opportunities with reach into the new types and greater volumes of data that are collectively known as “big data”
- More robust business analysis through more types of data and more extensive data integration
- More complete information through reach to new data types and greater data volumes
- Better quality information that translates to business syntax and context instead of delivery in systems and data storage context
The technical case for data virtualization is based on fast, efficient, and effective delivery of information by:
- Making data integration easier to achieve both in scope and timeliness of information
- Providing a platform for rapid, iterative development where information requirements can be discovered and change is not a barrier to quick delivery
- Reducing development cycles (time to solution) by eliminating the need to design and develop redundant data stores and processes to “lift and shift” data
- Making developers more productive with a development environment that focuses on business-perspective information delivery instead of detailed mechanics of data manipulation
- Supporting the discovery-driven requirements and test-driven development needs of agile development projects
- Breaking down the barriers of integrating structured and unstructured data into a single consumer view of information
How Does Data Virtualization Work?
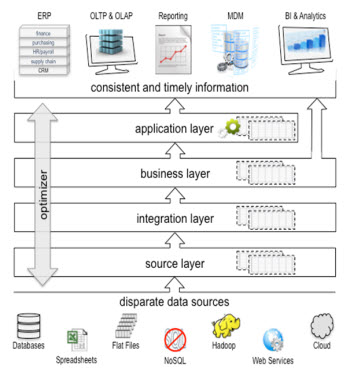
The role of data virtualization is to combine data from disparate data sources of many types and move that data at high speed to be delivered as high-quality, integrated, consistent, relevant, and timely business information. As with all complex problems, complexity becomes manageable when divided into logical parts.
The four layers of data virtualization, as illustrated in Figure 1, manage the path from physical views of data to application delivery of business views and services:
- A source layer implementing connection views. The source layer connects with many data structures and types using a variety of access languages. The source layer is the point at which decoupling--separating data use from data storage--occurs. When the source layer understands both read and write functions of each source, then multi-directional integration becomes possible.
- An integration layer with integration views. Here, data perspective shifts from data-storage syntax to business syntax. This layer delivers the transformation and federation capabilities to represent data relationships and data combinations not apparent in the individual data sources. Transformation capabilities are also applied for consistent representation of data and for data quality improvement.
- A business layer implementing consumer views. This layer shifts the perspective from business syntax to data usage. The views at this layer present data in accessible and understandable forms that make it readily available for business user consumption. The same views at this level support rapid application development activities such as prototyping and agile projects.
- An application layer implementing data services, consumer views, or a combination of the two. Both single-point-of-interface and usage specific information capabilities are supported here. The application layer spans data access capabilities, ranging from SOA applications to virtual data marts.
(Click for larger image)
Figure 1. The layers of data virtualization
When to Use Data Virtualization
Data virtualization isn’t a replacement for ETL. They are complementary technologies that can be combined to effectively solve complex data integration problems. Both belong in the data integration toolbox. To make sure you use the right tool for the job, choose:
- ETL and persistently stored data when you need to retain extensive history
- ETL when data transformations are more complex than can be gracefully handled in the integration layer of the data virtualization process
- ETL when you must limit source system access to a narrow, typically late-night, batch-processing window
- Virtualization when high speed and very low latency are required
- Virtualization when working with unstructured, semi-structured, and multi-structured data
- Virtualization for very large volumes of data where only a small portion of the data is typically accessed--the advantage of query-triggered rather than schedule-triggered data integration
Closing Thoughts
Data virtualization has come of age. Those who haven’t yet adopted it will soon find that they need to do so. Many turn to virtualization when they encounter data integration challenges where ETL can’t do the job. They soon discover that data virtualization is the natural choice for some kinds of data integration needs. More tools in the toolbox simply means more extensive data integration capabilities.
Dave Wells is actively involved in information management, business management, and the intersection of the two. He provides strategic consulting, mentoring, and guidance for business intelligence, performance management, and business analytics programs.

The Requirements for Being an Analytics-Based Organization
Hugh J. Watson
What is the status of analytics in your organization? If we are talking about descriptive analytics that describe what has already occurred, you may be pretty far along. If, on the other hand, we are discussing predictive analytics that forecast what will occur or prescriptive analytics that help determine what should occur, your enterprise may not be as far along the maturity curve.
In some enterprises, advanced analytics is moving from being a “nice-to-have” feature to a requirement for competing in the marketplace. Such enterprises are analytics-based organizations. For example, think of large online retailers that depend on advanced analytics for demand forecasting, pricing, dynamic display of product recommendations, customer segmentation analysis, campaign management, customer lifetime value analysis, and more.
The evidence is clear that many firms will and should employ advanced analytics. The question is--what does it take to become a successful analytics-based organization?
To find out, read this article and more by downloading Business Intelligence Journal, Vol. 17, No. 2

Highlight of key findings from TDWI's wide variety of research
Replacing MDM Platforms
An MDM platform can take many forms, involving any of the tool types and homegrown methods mentioned in the discussion of MDM tool portfolios, as well as dedicated tools and applications for MDM. Regardless of the definition, some users are contemplating a replacement of their MDM platform--and some aren’t. (See Figure 11.)
Roughly one-half of surveyed organizations (46%) have no plans to replace their MDM platform. This statistic is a mix of good and bad news. The good news is that some organizations are pleased with their current platform, because it satisfies business requirements for MDM. The bad news (confirmed in other passages of this report) is that other organizations consider their MDM solution inadequate, and they would like to replace it. Alas, they cannot secure approval and funding.
The other half of surveyed organizations plan (50%) to replace their MDM platform. If these plans pan out over the next five years, the average MDM solution will be quite different--and hopefully far better--than today’s average. This is good news, considering that many users are frustrated by the limitations of early generation solutions.
(Click for larger image)

Read the full report: Download Next Generation Master Data Management (TDWI Best Practices Report, Q2 2012)

FlashPoint Rx prescribes a "Mistake to Avoid" for business intelligence and data warehousing professionals.
Mistake: Confusing the Prerequisite with the Payoff
Marc Demarest
When I talk to my clients and others about big data, it’s hard to get past the talk about persisting and organizing large volumes of data so we can discuss analytics: processing those large data volumes to yield actionable value. Partly that’s the effect of other behavior patterns I’ve identified earlier, specifically Mistakes Two, Three, and Four.
This data-first thinking is an old habit. It got us in significant trouble in the early days of data warehousing, and its echoes persist in the high-failure-rate stories some analysts tell to this day. Well-organized data, at whatever volume, is at best latent value--and is often just an expensive monument to our own shortsightedness.
Competition in a big data world is based on the quality and precision of your algorithms and your analyses. Big data is really big analytics. By definition, big data analysis is beyond the boundaries of the brain’s ability to process and organize, and beyond the boundaries of conventional BI tools’ ability to represent visually. The analyses are either facilitated by code or produced by code, and are often consumed by code as well, with no eyeballs required. When eyeballs and wetware are required, they are exceptional eyeballs and exceptional wetware--for the most complex, nuanced judgments we can imagine.
I’ve begun to despair slightly when a conversation with a client or colleague begins “What do you think of NoSQL?” or “We think we’ll need thus-and-such bandwidth and storage to persist 3 TB a day by 2015 …”
By contrast, the best conversations I have with people about big data begin with “We have this idea for a great analytical application that consumes large data volumes and lets us change the game in our market …” or words to that effect.
Read the full issue: Download Ten Mistakes to Avoid in Big Data (Q2 2012)

