 View online: tdwi.org/flashpoint


January 12, 2012
ANNOUNCEMENTS
New TDWI Checklist Report: Hadoop: Revealing Its True Value for Business Intelligence
New TDWI Monograph:
Seven Keys to High-Performance Data Management for Advanced Analytics
CONTENTS

Six Steps to Effective
Performance Scorecards
Data Architects Are Facilitators

Technology Drivers for New Generations of Data Warehouses

Mistake: Ignoring the Strategic
Value of Dimensional Design

See what's
current in TDWI Education, Research, Webinars,
and Marketplace
Six Steps to Effective
Performance Scorecards
Dave Wells
Topic:
Performance Management
Performance scorecards are a popular form of BI reporting, but they frequently have little real impact. Scorecards make a difference when linked directly to business strategy. When scorecards are aligned with an enterprise's strategy, they trigger conversation, drive analysis, and lead to effective management action. For make-a-difference scorecards, use strategy mapping as part of your requirements process.
1. Define Your Strategy
Your strategy is a statement of the future position you want to achieve. You can’t build a strategy map without first defining your strategy, which is best defined in terms of desired outcomes that describe how you want to be viewed externally (for example, by your customers, shareholders, and regulators).
- What are the categories of strategic outcomes?
- What is the time frame for the strategy map?
- What are the desired outcomes?
2. Map the Influences
Influence mapping is the heart of strategy mapping--looking at each desired outcome to determine the drivers of each outcome, then looking at those drivers to identify what drives them, continuing iteratively to construct cause-and-effect chains. If, for example, profitability is a desired financial outcome, then we seek influences on profitability and identify revenue and expenses. Next, we determine what influences revenue and what drives expenses. We continue following these chains to account for drivers and influences from all parts of the enterprise.
To achieve the enterprise view, we need to work with performance categories. A typical strategy map uses the performance categories that are defined by the balanced scorecard: finance, customer, processes, and learning and growth. You may want to adapt the categories to be more specific to your organization and industry. The goal is a set of perspectives that describe a high-level causal hierarchy.
For example, financial outcomes are driven by customer performance; customer outcomes are driven by process performance; and process outcomes are driven by learning and growth. Describe the hierarchy best suited to your enterprise--perhaps finance at the top for private-sector companies, but customer at the top and finance at the bottom for public-sector companies. The top-level perspective is the category in which most strategic outcomes are positioned.
- What performance categories are right for your strategy map?
- What causal hierarchy is represented by the performance categories?
- What are the cause-and-effect chains that lead to strategic outcomes?
3. Identify Performance Levers
Application of the strategy map begins by identifying performance levers--the points in cause-and-effect chains where relatively small investments of time, money, and management attention bring substantial improvements in business performance. Any element of a cause-and-effect sequence where business managers can act to change outcomes is a potential performance lever. The most powerful levers are those points that have very strong positive influence on outcomes and where a single point influences many desired outcomes. Powerful levers that can be activated with modest investment and effort are especially effective for strategy execution.
- What performance levers are evident in your strategy map?
- Which are the most powerful levers? Which are least powerful?
- Which levers can be activated with reasonable investment and effort?
4. Define KPIs
Key performance indicators (KPIs) are the measures needed to monitor the effects of applied performance leverage. Each performance lever may have both leading indicators that help forecast and set expectations, and lagging indicators to monitor results.
For each performance lever:
- What are the leading and lagging indicators?
- Which indicators are actionable (i.e., can be affected by management actions and managers know how to affect)?
- Which indicators are key (that is, most important) indicators?
5. Define Performance Metrics
KPIs can’t be applied effectively unless they are quantified as business metrics, monitored via scorecards, and can be analyzed to understand business trends and behaviors. Quantities, dimensions of analysis, and frequency of measurement are essential parts of defining metrics.
For each KPI:
- How is the indicator quantified? What is the unit of measure?
- What are the dimensions of analysis?
- What is the frequency of measurement?
6. Identify Data Requirements
Once metrics are defined, translating data requirements is relatively straightforward. You’ll need to collect quantities, identities, time stamps, and dimension/reference data. The hard part is often determining the data sources. You may also need to collect comparative data such as the values for past performance and the target values for each indicator.
For each metric:
- What data is needed to calculate and report the metric values?
- What data is needed to support evaluation and analysis?
Dave Wells is a consultant, teacher, and practitioner in information management with strong focus on practices to get maximum value from your data: data quality, data integration, and business intelligence.

Data Architects Are Facilitators
Chris Adamson
Oakton Software LLC
Topic:
Data Analysis and Design
For a data architect, data modeling is only half the job. In fact, usually it’s the easy part. The other part of the job is much more difficult: balancing the concerns of several important constituencies. The best data architects are not just good modelers; they are also skilled facilitators and consensus builders.
The Balancing Act
Although database design is governed by a set of principles and best practices, there is never a single “correct” solution. Particularly with dimensional designs, data architects routinely choose between several design options. Many of these decisions have significant impacts on functionality, performance, development tasks, and time.
These choices require the data architect to balance several important perspectives, some of which are likely to conflict. Communication and facilitation are essential skills for meeting this challenge. The goal is to finalize a data model and obtain buy-in from the parties affected by the outcome.
The best way to reach this consensus is through a design review session for your dimensional models. In attendance should be stakeholders who represent five essential perspectives:
1. The Business Perspective
The most obvious impact of a design choice is how it affects analytic capability. Design choices that avoid thorny issues, for example, also tend to reduce functionality. Technical staff can assess how each option affects development and system performance. IT managers can assess the impact on cost.
However, none of these parties is empowered to assess acceptability from a business point of view. Your business sponsor (or a designated advocate) should fill this role. Only this person can tell you if it is permissible to flatten that troublesome hierarchy or whether you can eliminate a large chunk of the model that offers only limited value. By working through design options together, you can strike a balance that will be communicated across the business and technical sides of the project.
2. The BI Architect’s Perspective
A business intelligence architect assesses the impact of a design on product development--queries, reports, dashboards, and self-service environments. The BI architect understands the tools used to produce these products, as well as the work required to deliver them.
The capabilities of these tools will influence some decisions. It may be possible for a tool to automate the selection of aggregate tables, for example, if the design adheres to specific guidelines for the structure of summary tables. Level of effort is also a consideration. Development effort may be vastly streamlined by adding components to the model that precompute comparisons, set operations, and correlations.
3. The ETL Architect’s Perspective
The impact of a design choice on the ETL process is often inversely proportional to the impact on BI developers. To the extent that the ETL architect is part of the decision-making process, this increased workload will not become the source of friction during the solution’s development and delivery.
Historically, we have accepted that ETL work is the price we pay for the analytic capability we deliver. As we push the limits of how much data can be processed or how often we process it, it becomes important to weigh the cost of doing so against the benefits delivered.
4. The Database Administrator’s Perspective
Database administrators are entrusted with making sure the solution meets response-time objectives. They examine how choices will affect their ability to configure the database to leverage features such as parallelism, to index the solution to ensure proper performance, and to tune the environment to handle the chaotic onslaught of queries.
The database administrator may also be able to suggest alternatives that reduce work in other areas. Summary data and derived schemas, for example, may be better provided through database features rather than manually implemented via the ETL process. Likewise, constructs such as views may be useful stand-ins for other data structures that might otherwise require additional care and feeding. The database administrator brings these options to the table.
5. The CIO’s Perspective
Design choices can profoundly impact the time and resources required to deliver and maintain the solution. It stands to reason, then, that the owners of these resources have a say in the decisions. Your BI program management or CIO is ultimately accountable for deadlines and costs. Bringing this final perspective to the table helps ensure that the final solution aligns with these program-level concerns.
The successful data architect balances these five perspectives, facilitating a group consensus on the data architecture. This shared acceptance paves the road to success, preparing the team for the hard work that is to follow.
Chris Adamson provides strategy and design services through his company, Oakton Software LLC. For more on managing your data architecture, see his latest book, Star Schema: The Complete Reference (McGraw-Hill, 2010).

Highlight of key findings from TDWI's wide variety of research
Technology Drivers for New Generations
of Data Warehouses
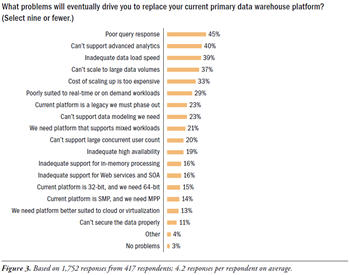
To quantify why so many organizations are planning to replace their data warehouse platform, TDWI asked: What problems will eventually drive you to replace your current primary data warehouse platform? (See Figure 3.) If we group survey responses, five areas emerge where users are having problems with their current data warehouse platforms. Each of these problems is a technology driver that leads organizations toward a next generation data warehouse:
Analytics of various types. Many data warehouses have evolved (based on users’ designs and usage) to become platforms for reporting or basic online analytic processing (OLAP). As these users try to move beyond reporting and OLAP, they find that their platform “can’t support advanced analytics” (40%). There are multiple forms of advanced analytics, including those based on data mining or statistics and those based on complex ad hoc SQL statements. The former may or may not run in a DBMS (depending on the vendor’s analysis tool capabilities), which is a problem when it forces users to move data out of the data warehouse for the sake of analysis, then back in. The latter methods (based on SQL) are hamstrung if the platform suffers “poor query response” (45%). Of course, many other DW and BI functions suffer when queries are slow.
Real-time and related technologies. An ongoing trend involves integrating an organization’s data warehouse with its transactional and operational applications. Such efforts are stymied when the DW platform is “poorly suited to real-time or on-demand workloads” (29%). A number of issues relate to real-time operations. For example, a DW isn’t real time or on demand if it’s hampered by “inadequate high availability” (19%), “inadequate data load speed” (39%), or “inadequate support for Web services and SOA” (16%).
Scalability, in many senses. A DW platform can’t cope with growth over time if it “can’t scale to large data volumes” (37%) or it “can’t support a large concurrent user count” (20%). Achieving these goals is difficult when the “cost of scaling up is too expensive” (33%).
Addressable memory space. One of the leading reasons for replacing old server hardware is because the “current platform is 32-bit, and we need 64-bit” (15%). The primary advantage of 64-bit hardware and software is its large addressable memory space. Hence, by comparison, 32-bit systems may suffer from “inadequate support for in-memory processing” (16%).
Warehouse architecture and related practices. Architectural issues voiced in users’ survey responses include “we need a platform that supports mixed workloads” (21%), our “current platform is SMP, and we need MPP” (14%), and “we need a platform better suited to cloud or virtualization” (13%).
(Click for larger image)
Source: Next Generation Data Warehouse Platforms (TDWI Best Practices Report, Q4 2009). Access the report here.

FlashPoint Rx prescribes a "Mistake to Avoid" for business intelligence and data warehousing professionals.
Mistake: Ignoring the Strategic Value
of Dimensional Design
By Chris Adamson
A dimensional model is far more than the basis for a database design; it also provides several strategic functions. However, these are often misunderstood or mistakenly attributed to a specific architectural paradigm. Understanding these functions is essential for success.
In Ralph Kimball’s dimensional data warehouse architecture, an enterprise dimensional model is used to capture requirements from across the enterprise, establish development priorities, and identify resource requirements. It enables incremental implementation of subject area applications while avoiding the risk of incompatibilities, or stovepipes. The dimensional model itself is used to define and manage the scope of implementation projects.
In W.H. Inmon’s Corporate Information Factory (CIF) architecture, dimensional data marts are derived from a central data repository that is not dimensional. However, many of the same strategic benefits are available. Dimensional representation of business processes remains an effective way to define requirements. Data mart implementation can be planned around the model, facilitating compatibility within and across data marts, and the model may be used to manage project scope.
Standalone data marts are constructed in the absence of an enterprise context. This architecture often results from mergers and acquisitions, or is selected for short-term cost or expediency advantages. Dimensional design is unable to guarantee the same benefits of compatibility across subject areas. Within a single data mart, however, it can still serve as the basis for requirements definition, prioritization, and incremental implementation. Most important, it remains the most effective tool for defining project scope.
Source: Ten Mistakes to Avoid Dimensional Design (Q4 2009). Access the publication here.

