


| EDUCATION |
|
TDWI Introduction to Business
Analytics Business Analytics for Insight and
Foresight TDWI Dimensional Data Modeling Primer: From
Requirements to Business Analytics |
| WHITE PAPERS | |
|
| WEBINARS | ||||||||||||||||||
|
||||||||||||||||||


| ABOUT TDWI EXPERTS |
TDWI Experts is a twice-monthly e-newsletter where BI/DW thought leaders share opinions and commentary about relevant industry topics and the latest technologies. |


October 7, 2010
What's Hot: Reflecting on Sticky Dots at the BI Executive Summit
Wayne W. Eckerson
Director of TDWI
Research
Topic: Experts in Business Intelligence
Twice a year at TDWI's BI Executive Summit, we have attendees engage in "sticky-dot" voting. In the age of wireless and electronic devices, this paper-based approach is decidedly backwards, yet just as fun and informative (see photo). Our latest BI Executive Summit took place in August, 2010 in San Diego.
|
|
|
Photo by Olivia Eckerson |
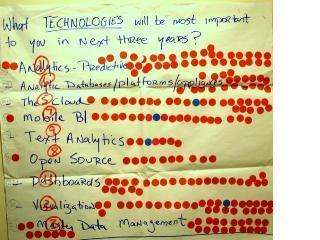
Perennial Favorite. We always ask the audience, which is comprised of 75 percent BI directors and 25 percent BI business sponsors, to place a sticky dot on three technologies that will be most important to them in the next three years. At the past four Summits, predictive analytics has captured the lion's share of the sticky dot votes, and this year was no exception. Predictive analytics scored 39 of the 202 votes cast.
Judging by the number of articles and events with "analytics" in the title, this certainly seems to be the "year of analytics." Although analytical techniques and algorithms have been around for decades, we are just now reaching the point where our organizations and BI teams are ready to embrace predictive analytics. We now have large volumes of data in data warehouses, high-performance analytic platforms to process big data in a cost effective way, and executives who think "analytics" can give their organizations a competitive advantage.
What remains to be seen is whether organizations can figure out where and how to apply analytical techniques and technology and develop the internal skills and organizational structures needed to succeed in this new endeavor. So, although interest in analytics has reached a crescendo, it's unclear whether analytics will succeed in the trenches of mainstream organizations.
Emerging Technologies. What was surprising about this Summit's voting is the technologies that finished in second and third place. Visualization jumped out of nowhere to capture the second spot with 30 votes, followed closely by master data management (MDM) with27 votes, which has been simmering steadily in the background and now looks ready to boil.
Visualization. I asked several colleagues why visualization may have scored so high. Some suggested that the growing visibility of visual analysis upstarts, such as QlikTech, Tableau, and Tibco Spotfire, may account for the increased interest in visualization. These same tools are also being given a boost by hype around "in-memory processing" which delivers speed-of- thought analysis. Because in-memory wasn't a choice, perhaps visualization was the next best stand in. SAP has also spent oodles to market its "Explorer Accelerated" technology which combines in-memory technology with a visualization interface to deliver speed of thought "exploration" of subject-area data marts.
Perhaps the most satisfying explanation is that every BI vendor has spent the past two years upgrading its graphical user interface with Flash and AJAX to deliver a more modern look and feel. Thus, almost every BI customer has been bombarded by vendors eager to display their new displays, so the cumulative effect is significant.
Sponsored Links |
Mastering Data. MDM has been a "hot" topic for several years, but never scored high in our informal polling. It appears MDM has moved past the hype phase to the implementation phase where organizations now recognize that they can significantly reduce the costs of running their data warehousing operation by cleaning and standardizing data before it even gets into their BI environment. To implement MDM, however, organizations need to first implement a data governance program which defines the mechanics by which the business will treat "data as a corporate asset." Unfortunately, many companies struggle data governance, especially when implementing it as a top- down program. The best data governance programs evolve bottom-up through tactical projects aimed to solve immediate business problems.
Dashboards. Performance dashboards, which finished in fourth place with 25 votes, is the highest-rated technology to experience a downward slide in the sticky-dot polling. A regular second-place finisher, performance dashboards may have split its vote with visualization, which had never been on the list before. Obviously, dashboards offer a highly visual medium for displaying data, and organizations continue to deploy them in droves (even if they are not exactly sure what to call them). However, 2000 to 2010 was the decade of the performance dashboard as companies discovered the power of monitoring key business metrics, so, it's nearly time for performance dashboards to share the limelight with other emerging technologies.
Some of the emerging technologies exhibited strong growth in sticky-dot polling compared to previous results. Top contenders are BI in the cloud (fifth place with 24 votes), analytic databases (sixth place with 20 votes), and mobile BI (seventh place with 11 votes). Other notable technologies didn't make the list (an oversight by yours truly.) These include BI search (which still needs time to percolate) and operational BI (which is going mainstream at an accelerated pace).
Agile BI. We also had a second round of voting for "methods and techniques" that would grow in importance during the next three years. Not surprisingly given the theme of our conference, "agile BI" topped all contenders, grabbing 49 votes out of 186. Agile BI was followed by perennial favorite data quality (37 votes), BI governance (34 votes), talent recruitment (26 votes), and the BI Center of Excellence (20 votes).
Given the buzz around BI Centers of Excellence, I thought this topic would score higher. However, organizations are recognizing that a BI Center of Excellence really doesn't work until the BI program has reached a mature stage. Because most BI programs are still "teenagers" according to TDWI's BI Maturity Model assessment, it makes sense that most organizations have yet to step up and tackle this topic.
The next BI Executive Summit will be held at Caesar's Palace in Las Vegas on February 14 to 16. I hope to see you or your BI executive there!
Wayne W. Eckerson is director of TDWI Research. Wayne can be reached at [email protected] .