

October 7, 2010
ANNOUNCEMENTS
TDWI has redesigned its site to offer users a more usable interface and optimized performance. We appreciate your feedback! Look for the green sections for exclusive Member content.
CONTENTS

Building a Better Business Case
Is Critical to MDM Success

See what's
current in TDWI Education, Research, Webinars, and Marketplace

Building a Better Business Case Is Critical to MDM Success
Dan Power
Hub Designs
Topics:
Master Data Management, Business Case
A business case is an invaluable tool in the early stages of a master data management (MDM) initiative.
Teams are usually relieved when senior management tells them the need for MDM at their company is so obvious that a business case isn’t required. When that happens, everyone is grateful because it saves a lot of work.
However, it’s a false economy. Projects launched without a business case are at a serious disadvantage because there’s no expected return on investment (ROI). Without an ROI target, how do you know when you’ve achieved it? In other words, how do you know when you’re finished?
More important, without a business case, it may be difficult for the IT team to gain buy-in from the business. To business leaders, MDM can look a lot like infrastructure or plumbing. Challenges--such as upgrading how the enterprise handles master data; improving data quality and processes for entering, managing, securing, and consuming master data; and building integration via Web services from a new master data hub to various source systems and downstream systems--usually fail to capture the imagination of the various business owners around the enterprise.
Ask these same business owners for their pain points and horror stories and you’ll learn a lot. Inefficient processes, unnecessary costs, missed revenue opportunities, and regulatory problems relating to customer, product, and supplier information; data management; and data governance are issues that significantly impact the business. Business owners are the best source for the facts you need to make your business case. Get them to assign a dollar amount to these issues so you can quantify the “as-is” starting point.
There are three classic drivers for master data management:
- Increasing revenue
- Reducing costs (or avoiding cost increases)
- Regulatory compliance and risk management
Choose the metrics you want to use and decide how to measure your company’s current performance against those metrics. Develop a simple scorecard for tracking these metrics over the life of your program. This will give you an accurate, agreed-upon before and after picture to show the improvements that result from your MDM program.
Next, sit down with the stakeholders and discuss how your program can improve those metrics. Don’t forget the 80/20 rule: 80 percent of your benefits will probably come from 20 percent of your results.
Don’t try to “tin cup” your way into MDM. Go after the big problems with your company’s master data--the “800-pound gorillas” in the room that no one else has been able to tackle. The glory comes from solving the big problems.
Convert the improvements in your metrics into financial results. For example, a few days’ reduction in days sales outstanding due to improved delivery of customer invoices can mean tens of millions of dollars to the bottom line in a large enterprise. Strategic sourcing programs using better supplier master data can unlock millions in cost savings. Better customer data (when you also pull in information on customer behavior) can lead to more targeted marketing programs that drive millions in increased revenue.
Now that you have a handle on the benefits, take a detailed look at the costs. What’s your total cost of ownership going to be? Take into account all of your implementation costs (including organizational change management) and your costs beyond year one (i.e., ongoing costs such as software maintenance, data stewardship headcount, third-party data enrichment).
You now have everything you need to calculate return on investment. Your organization may have a standard template for ROI calculations or you may have to create your own.
Don’t file that business case away just yet, though! You’ve created a compelling business case to explain your ROI analysis and sum up the arguments for your MDM program. You’ve been through endless meetings and changes to your assumptions, benefits, and costs. Your project was approved and you can proceed to solving your company’s master data challenges. At strategic points throughout the project and when it’s completed, review your business case. Use it as a tool to compare how your project is doing relative to expectations, and to manage your project throughout its lifecycle.
Also, don’t forget to communicate regularly with your stakeholders and the extended organization about the initiative and its successes. Develop a communications plan to keep people aware of what you’re doing as the project unfolds and how the initiative is positively impacting the rest of the company.
Building a comprehensive business case before you launch your MDM initiative will pay dividends throughout your MDM program.
Dan Power is the founder and president of Hub Designs, a management and technology consulting firm specializing in developing and delivering high-value master data management (MDM) and data governance strategies.

Data Quality Mathematics
Christina Rouse and AnneMarie Scarisbrick-Hauser
Incisive Analytics LLC
Topics:
Data Quality, Baseline Data Assessment
Successful organizations understand the value of data as a corporate asset. Like any asset, data must be managed with the investment of dollars, time, and effort. If not, the asset’s value degrades and increased maintenance costs outweigh any further benefit. Those who value data as an asset also understand the link between data quality and business performance. The performance level of information-intensive applications, such as business intelligence, customer relationship management, and enterprise resource planning, is dependent on the accuracy, completeness, and reliability of the data.
It can be difficult to treat data as a corporate asset, especially when you try to present a business case for long-term data quality initiatives to senior managers who don't view data quality as a critical asset. Despite an awareness of the negative impact of bad data on business, many organizations do not know the quality of their data because they neither measure nor monitor it. Companies that monitor data quality understand the impact of data quality in terms of missed sales opportunities, supply chain management issues, failed customer relationships, and weak strategic planning efforts. The lack of established factual evidence makes it difficult to gain financial support for data quality initiatives.
Creating standards for expected information quality is a business responsibility; it initially requires a series of baseline data quality assessments to identify critical data quality issues, measure their impact, establish expected data quality targets, implement prioritized data quality initiatives, and systematically monitor the progress to meet targets such as established costs of non-quality information and business results of quality information.
How do we generate evidence of data quality issues? First, conduct a calculated data baseline assessment, which displays and describes quality issues identified by business and IT users. The scope of the data quality assessment includes the selection of prioritized critical data fields from your processing applications. Next, create a data extract generated with a random or stratified sampling formula to assure proportional representation of every business area. Using a random sampling approach instead of “boiling the ocean” saves time and effort processing the data. A stratified random sample of data includes samples from product categories, business lines, or customer geographical locations. A data extract will also provide insight into the quality of data integration, primary key matching success, and use of consistent data-naming standards.
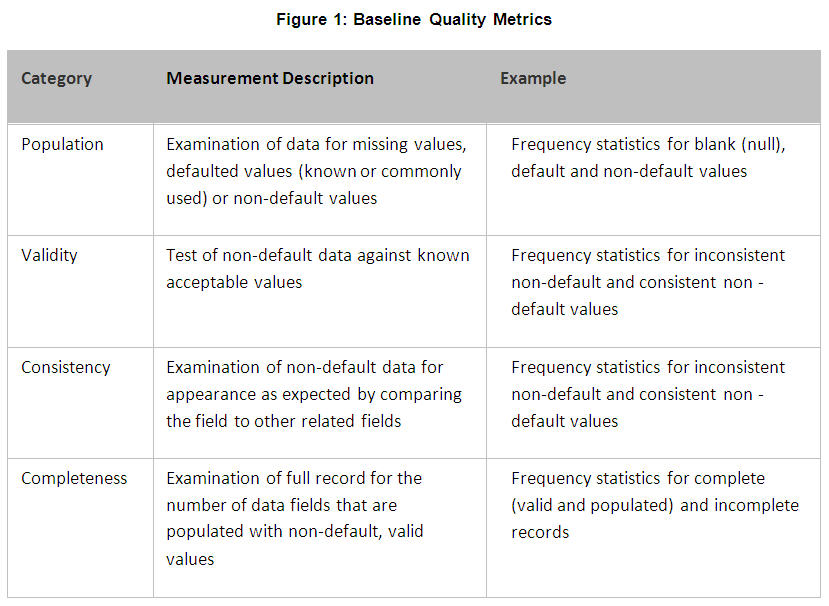
The baseline assessment findings include a comparison of user perceptions against mathematical metrics. For example, did the assessment agree with user perceptions of data as it is supposed to be (data quality), is data in the correct context (data integrity), and is data and its associated metadata accessible (data usability)? Baseline data assessment findings provide a data-field-by-data-field value for the four metrics of population, validity, consistency, and completeness (Figure 1). Data quality profiling enables an organization to answer the following questions about its data:
- How populated are these fields?
- Which fields have sufficient levels of completeness?
- How many fields contain valid and consistent values?
Following review of the baseline data quality assessment, identify a series of key data elements (KDE) for future monitoring efforts. Create targets, including dates for remediation; establish expected cost savings for continuous improvement. Monitoring activity over time serves several purposes: First, it provides regular reports on data quality characteristics to business data consumers. Second, information is available at the enterprise and detail level. Third, regular reports are generated for senior risk managers on the data quality of specific data points related to the Patriot Act, Basel II, Sarbanes-Oxley, HIPPA, GLBA, AML, and International Accounting Standards (IAS).
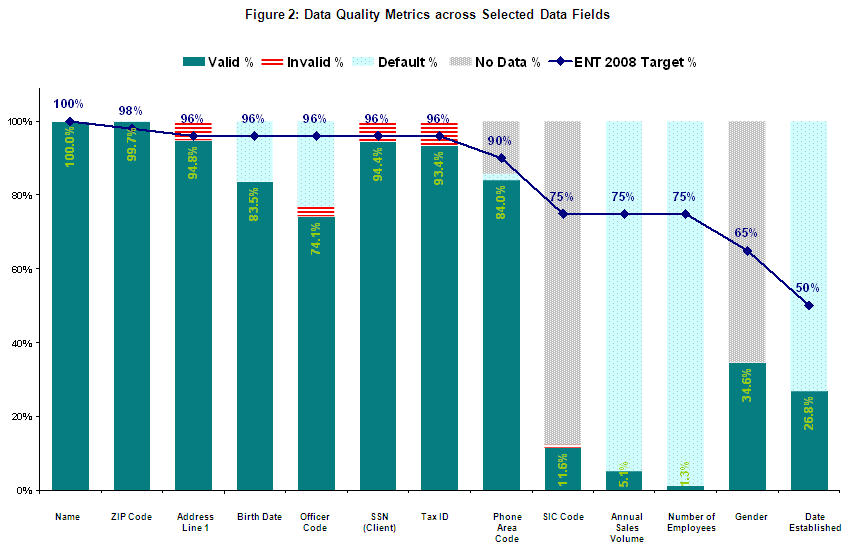
Producing and publishing regular data quality reports and scorecards is one way to motivate managers and data collectors to provide data that meets the needs of information consumers across the company. The regular distribution of summary reports is one of the key tools for ensuring that data quality is embedded in the organization’s culture (Figure 2). This simple report format includes a target-driven trend line that provides an easy way to track the progress of data quality issues. This fact-based approach provides the information needed to change business processes and work practices.
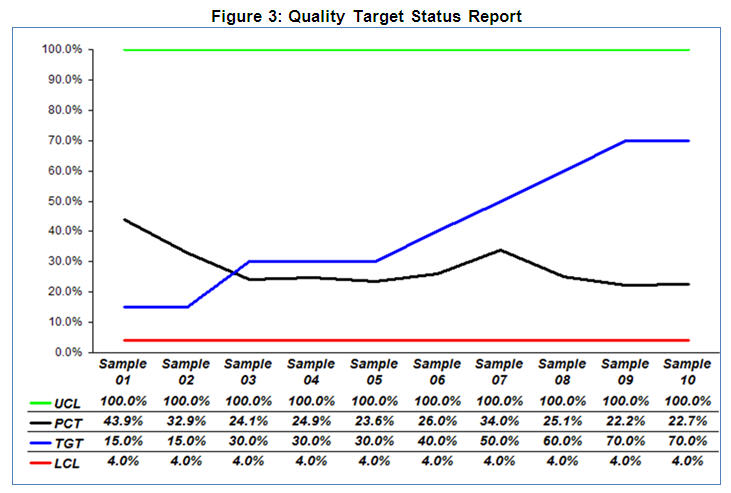
Figure 3 presents another approach for tracking quality targets against an established series of thresholds; all chart lines display normalized measures (including validity, completeness, and consistency). Charts can display a single data element, composite data elements, compliance groups, or business-defined groups. Charts are automatically updated with each new sample and can show repeated samples or new customers tracked over time. Actual performance (PCT) is tracked against established targets (TGT) within the context of an upper compliance limit (UCL=0 error), and the lowest experienced level of quality (LCL).
Leveraging the long-term value of a baseline data assessment and quality metrics-monitoring scorecards will enable your organization to generate senior management support, prioritize data quality issues, set targets, and ultimately design the processes that will ensure high levels of data quality are maintained.
Christina Rouse, Ph.D., is chief architect for Incisive Analytics LLC. An improvement catalyst, Chris applies BI strategy for performance improvement. Leveraging two decades of data experience on a broad range of technical platforms, she developed a technology-agnostic approach to BI consulting.
AnneMarie Scarisbrick-Hauser, Ph.D., is senior strategist for Incisive Analytics LLC. AnneMarie specializes in enterprise BI, marketing analytics, and data management solutions. She has more than two decades of analytical data management, corporate data governance, data stewardship, and data-integrity program experience.


Highlight of key findings from TDWI's wide variety of research
Data Integration Options
Performing data integration with SAP ERP is inherently difficult because of the complexity of SAP ERP’s data structures and how they should be accessed. For example, SAP ERP’s data model involves tens of thousands of tables with table and column names that are somewhat cryptic. Plus, there are numerous unique data structures such as pool tables, cluster tables, iDOCs, hierarchies, and logs. The data of a single record may be distributed across many of these data structures, so accessing them directly is difficult and may lead to data integrity problems. Instead, it’s usually best to access data through the application layer of SAP ERP, which involves function calls into the SAP business application programming interface (BAPI) or SAP’s query language ABAP (which is similar to SQL).
Hand-coding continues to be a prevalent practice in data integration, and some SAP users and consultants write ABAP code or routines that call BAPIs (28% in Figure 24). But this kind of hand coding is hard and seldom reusable. So, most SAP users minimize their exposure to SAP ERP’s complexity by relying on the integration capabilities built into SAP ERP and NetWeaver (81%) or data integration tools from third-party vendors (32%), especially tools that support the data integration method called extract, transform, and load (ETL). Respondents averaged 1.4 responses in Figure 24, which reveals that SAP users are like others: most perform data integration with a combination of hand coding, dedicated tools, and functions built into larger systems.
Source: Business Intelligence Solutions for SAP (TDWI Best Practices Report, Q4 2007). Click here to access the report.


FlashPoint Rx prescribes a "Mistake to Avoid" for business intelligence and data warehousing professionals.
Mistake:
Mismatch of Skills
By Dave Wells
Not everyone is cut out to be a consultant. It is a demanding occupation that requires a diverse set of skills. Three skill areas are indispensable; every successful consultant must have them. Human skills--the abilities to work effectively with people, both individually and in groups--are a must for every consultant. Consulting is a people business first. Research, as described in Mistake Six, is another core skill. And active listening—seeking feedback in verbal, visual, and behavioral forms--is critical to fact gathering, as emphasized in Mistake Four.
Beyond the core skills, a consultant may need to wear many hats--and to be constantly aware of which hat he or she is wearing. Facilitator, detective, analyst, teacher, mentor, architect, designer, reviewer, critic, guide, evangelist, bearer-of-bad-news--all are among the many roles that a consultant may fill.
As a consultant, consciously assess your abilities in the core skill areas and actively work to refine these skills. Know where your talents lie among the many other roles and skills. When asked to fill a role for which you are poorly suited, seek an alternative, such as bringing in another consultant.
When hiring a consultant, don’t compromise on the core skills; know which of the many other skills are most important for you to have a successful consulting engagement. Don’t expect any consultant to be an expert in all roles. Seek consultants with talents in the areas where you have the most pressing needs.
Source: Ten Mistakes to Avoid For Successful BI Consulting (Q3 2007). Click here to access the publication.


