


August 5, 2010
ANNOUNCEMENTS
Participate in TDWI Research: The TDWI Salary, Roles, and Responsibilities Report--an exclusive Member benefit--is coming up in Q1 2011. Take the 10-minute survey and help generate the data for this popular report.
CONTENTS

Five Dysfunctions of a Business Intelligence Team

Data Volume and Growth
Rates for BW

Mistake: Not Planning for Data Quality and Master Data Management

See what's
current in TDWI Education, Research, Webinars, and Marketplace
Do You Know Your BI Costs?
Bill Collins
DecisionPath Consulting
Topics:
Software-as-a-Service, Cost Management
Advocates wanting to sell a business intelligence (BI) initiative to the executives who fund it should be aware of a new development in IT called software-as-a-service (SaaS), also known as “on demand.” A fundamental element of the SaaS approach is that subscription-based pricing (e.g., $200 per user per month) makes costs transparent.
The emergence of SaaS matters to those in BI because it has conditioned executives to expect to know in advance what an application will cost. Therefore, it will serve us well to understand and make as transparent as possible the cost of legacy manual/spreadsheet-based reporting and analysis approaches and the cost of replacing them with professionally designed and developed BI applications so we can communicate a complete and compelling value proposition for BI.
A good place to start in a quest for understanding costs is the current way of doing things. As we all know, the most widely used BI tool is Microsoft Excel. No matter what we call it--“manualytics,” “spreadmarts,” “shadow IT,” or something else completely--it’s a ubiquitous approach to reporting and analysis in which users perform the work themselves with spreadsheets. The risks of using spreadsheets--they’re error-prone, unrepeatable, untraceable, and unauditable--have been well documented, so we need not discuss them here. An aspect of spreadsheet-centric reporting and analysis that we do need to consider is its cost.
Many organizations do not know their manual/spreadsheet-based reporting and analysis costs. In a recent survey we conducted for a research paper about business performance management (BPM) and BI alignment, we asked respondents with manual and/or spreadsheet-based BPM processes what their annual cost is. The most common answer, given by 45 of 121 respondents (37.2 percent) was “Don’t know.”
Some organizations do know what it costs, and the answer is a lot! One of our consulting clients used a Balanced Scorecard framework for performance management. Scorecards were updated monthly using a manual and spreadsheet-based process. The client calculated that the staff effort to generate its monthly performance scorecards cost $2 million per year!
Not understanding current costs impedes the development of a business case for investment in BI. The best and most inspiring justification for investing in BI is the business value of better information and more effective decision making, but it is also the most difficult to quantify. Replacing legacy manual processes and thereby reducing or eliminating the costs associated with them can seldom be the sole justification for a BI project, but it is more easily quantified than potential benefits and needs to be included in the business case.
It also is common for organizations to not know the cost of their BI and data warehousing (DW) software tools. A recent consulting client that used multiple BI tools wanted to standardize on only one. When we asked, “How many licenses do you have for each BI tool, how much was the initial licensing fee, and what is the cost of ongoing maintenance and support from the vendor?” the client had no idea. Given that one of the justifications for standardization was the elimination of redundant maintenance and support costs, not knowing those costs made constructing a compelling argument for standardization more difficult.
Some elements of the BI/DW infrastructure (virtualized servers, SANs, and the communications network, for example) are commonly shared across BI and other applications, making the portion of their cost attributable to BI difficult to determine. However, the cost of other elements of a BI program--dedicated infrastructure, dedicated BI staff, and BI/DW software maintenance, among others--can and should be known. Return on investment (ROI) is a function of benefits and costs; to understand the ROI from BI, we must know its costs.
Before we can attend to the technical aspects of BI, we first must address the business aspects, beginning with the costs we will eliminate (manual/spreadsheet-based reporting and analysis) and the costs we will incur (building and operating the BI application). Executives expect, and deserve, no less from us.
Bill Collins is director of business solutions for DecisionPath Consulting, which specializes in business intelligence, data warehousing, and performance management solutions. Contact Bill at 301.990.1661.

Five Dysfunctions of a Business Intelligence Team
Maureen Clarry
CONNECT: The Knowledge Network
Topics:
Business Intelligence, Team Management
Patrick Lencioni’s best-selling book, The Five Dysfunctions of a Team (Jossey-Bass, 2002), contrasts the characteristics of dysfunctional and healthy teams. It is an easy-to-understand model that reflects our experiences with business intelligence (BI) teams over the last 18 years.
We frequently hear that BI initiatives fail because they did not deliver results. Many companies attribute this to tools, technical skills, architecture, business changes, or inadequate personnel, but Lencioni’s model illustrates that a lack of results is frequently the outcome of a different set of underlying problems, starting with a lack of accountability, which, he writes, is caused by lack of commitment. Lack of commitment is caused by fear of conflict, and fear of conflict is caused by lack of trust.
If your team is not achieving results, it is worth your time to examine the pyramid of a dysfunctional team. In this model, the failure to deliver results originates from an unstable foundation created by a lack of trust.
(Click to enlarge)
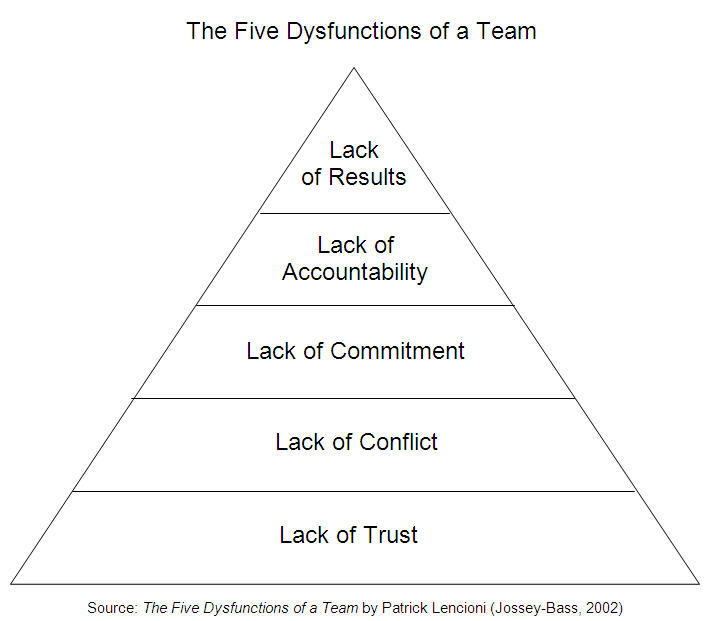
Lack of Trust
The word trust is often misunderstood and misused. Trust is the belief among team members that their peers’ intentions are positive. It’s possible to be honest about weaknesses, deficiencies, shortcomings, and mistakes without spending energy managing appearances and interactions. If teams trust each other in this context, it is more conducive to disagree.
Lack of Conflict
Conflict, in this instance, does not mean destructive fighting, attacks, or unproductive politics. If we want to produce the best BI solutions, there must be healthy debate in which people can disagree. We must quickly come to a resolution so we can move forward without residual damage. When conflict is stifled, people turn to triangulation and continually revisit issues. If teams can have a constructive debate where all viewpoints are heard, and then agree to move forward, they can buy in even if some disagree with the decision.
Lack of Commitment
The two biggest obstacles to commitment are ambiguity and consensus. Although there are circumstances in which consensus may be appropriate, always trying to achieve consensus can be time-consuming and produce mediocre solutions. Great BI teams commit to clear courses of action, sometimes with incomplete information, and support decisions once they are made. Clear deadlines and dates are key to promoting accountability.
Lack of Accountability
Top-down management is not the most effective means of maintaining high standards on a team. Peer pressure is more efficient than policies or systems. The anxiety of letting down respected team members is a key performance motivator.
Lack of Results
Good BI teams specify what they plan to accomplish in a given period. They have an unrelenting focus on what they collectively want to achieve. Functional BI teams make the collective results of the group more important than each individual’s goals.
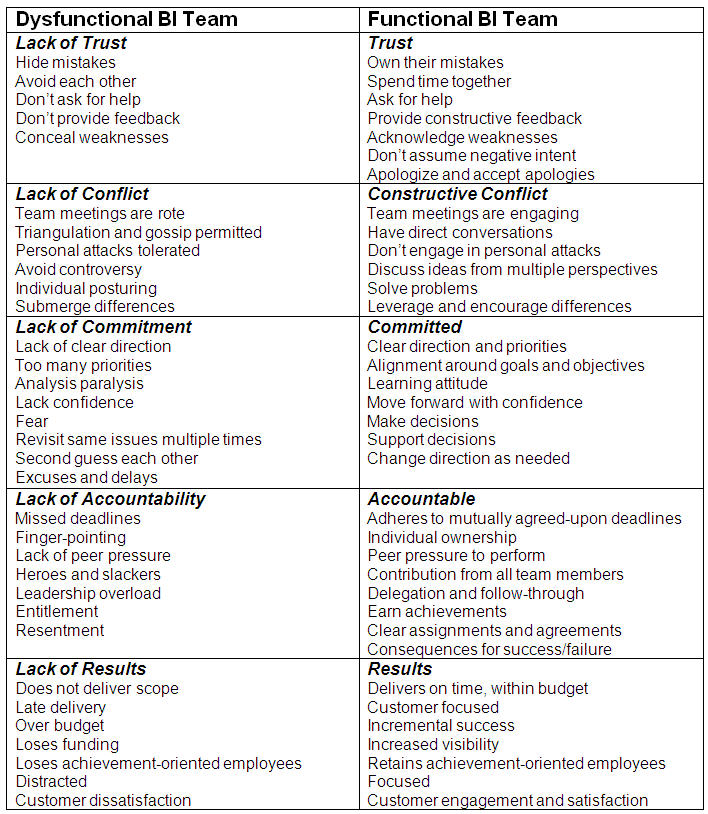
Your Team?
Is your BI team dysfunctional or functional? For a high-level diagnostic, read through the chart below and determine where to start. Is a lack of results really the fault of tools and technology, or is it something more basic in the pyramid?
(Click to enlarge)
Maureen Clarry is the CEO of CONNECT: The Knowledge Network, a consulting firm that specializes in data, technical, and organizational solutions for business intelligence. She has been on the faculty of TDWI since 1998. Maureen can be reached at [email protected] or 303.730.7171, ext. 102.
References
Lencioni, Patrick [2002]. The Five Dysfunctions of a Team, Jossey-Bass.

Highlight of key findings from TDWI's wide variety of research
Data Volume and Growth Rates for BW
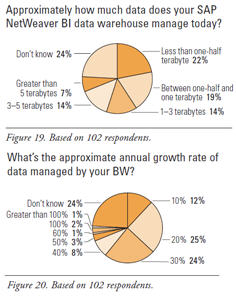
One of the most important metrics for judging a data warehouse platform is data volume scalability. To quantify the scalability of SAP BW, TDWI asked SAP users, “Approximately how much data does your SAP NetWeaver BI data warehouse manage today?” (See Figure 19.) Based on survey responses, 41% of BW instances manage one terabyte or less of data, and 35% manage greater than one terabyte. Twenty-four percent of survey respondents said they don’t know, which probably means that their BW instance manages so little data that tracking data volume isn’t necessary.
Of course, data volume is a moving target that grows constantly. So, TDWI asked “What’s the approximate annual growth rate of data managed by your BW?” (See Figure 20.) The greatest number of responses were for 20% annual growth (25% of respondents) and 30% growth (24%). If we accept these as the norm and average them together we get 25%, which represents the average annual growth rate of data managed by the average BW implementation.
Let’s provide a context for these data volume and growth numbers by comparing them to similar statistics TDWI has developed with other survey populations. For example, TDWI asked its Members (who use every data warehouse platform imaginable) to take a Technology Survey at its quarterly conference in May 2006 (143 respondents completed the survey). Fifty percent reported that their data warehouse will manage one terabyte or more by the end of 2007. This is higher than the 35% that SAP users reported. Based on responses to the Technology Survey, TDWI Members have data warehouses experiencing 33% annual growth in data volume, which is greater than the 25% that SAP users reported. TDWI found one SAP BW user who claimed to have broken the 10-terabyte barrier, which 8% of the TDWI Members surveyed have already done.
In summary, SAP BW instances handle data volumes and annual growth rates that are slightly conservative compared to those of the average data warehouse. Still, these figures prove that BW scales up into single-digit terabytes and occasionally higher.
(Click to enlarge)
Source: Business Intelligence Solutions for SAP (TDWI Best Practices Report, Q4 2007). Click here to access the report.

FlashPoint Rx prescribes a "Mistake to Avoid" for business intelligence and data warehousing professionals.
Mistake:
Not Planning for Data Quality and Master Data Management
By Karen Degner
“The bitterness of poor quality lingers long after the sweetness of meeting schedules is forgotten.” --Kathleen Byle
BPM is a framework for the successful communication and execution of strategy. An accurate and timely 360-degree view of the business is essential. In addition to regulations such as Sarbanes-Oxley, stakeholders are demanding greater transparency, auditability, and accountability. Core to this is confidence that the BI infrastructure provides timely, credible, comprehensive, enterprisewide information. The cost to the business for poor and inconsistent data can be enormous. In a 2006 TDWI Best Practices Report, Master Data Management, 83 percent of respondents reported that their organizations had suffered problems due to poor master data. BI was deeply affected; 81 percent of respondents reported that BI functions suffered.
MDM is critical for meeting these information demands, regardless of the data original source. Implementing MDM involves business process modeling, data mapping, cleansing, consolidation, reconciliation, migration, and the development of a master data plan, best resulting in the population of an enterprise data warehouse.
MDM is not for the faint of heart. Determining the systems of record, data ownership, stewardship, and standards requires consensus if they are to be accepted across organizational boundaries. The development of a permanent governance team to include both business and IT members is recommended. Executive commitment is paramount.
These activities, along with metadata management, will set the foundation for organizations to confidently monitor and manage the business proactively, while responding to stakeholder demands with world-class execution.
Source: Ten Mistakes to Avoid When Implementing Business Performance Management (Q1 2007). Click here to access the publication.

