


March 4, 2010
ANNOUNCEMENTS
Q1 Member benefits coming soon! The upcoming Member mailing, out on March 22, features the latest Best Practices Report, Business Intelligence Journal, Ten Mistakes to Avoid, and the annual TDWI Salary, Roles, and Responsibilities Report.
CONTENTS

Transpose-to-Expose Design: Transposing Data to Expose Business Value
Quality Assurance Testing: The Secret Weapon of Data Governance


Mistake: Treating Data Governance as Luxury, Not Necessity

See what's
current in TDWI Education, Research, Webinars, and Marketplace
Transpose-to-Expose Design: Transposing Data to Expose Business Value
Christina Rouse and Janet Kuster
Incisive Analytics LLC
Topics:
ETL, Business Intelligence
Organizations implement BI to exploit the business value of their data. After exhausting other reporting options, they typically look to BI for fast, enterprisewide analytics from a single package. Although BI vendors can’t say what the final product will look like, they are clear: there’s gold in the data if businesses can get it all in one place and start digging!
Businesses frequently make the mistake of thinking that BI is just the presentation tool that a smart analyst needs to do a better job. When it comes to digging for gold, this couldn’t be further from the truth. The BI model design determines how much business value will be exposed to the business community. A great BI model design translates into golden nuggets with a variety of industry-standard tools.
It’s important to understand the role that different model designs play in exposing business value. A simple mirror of the source system data storage design will limit a user’s ability to exploit the business value of data--that’s why IT generally creates reports that query against the transaction system. A better model design restructures the data into a more analytical organization, resulting in a data warehouse that is user friendly and more widely adopted by the business community.
As users become comfortable using the data warehouse, their questions grow more complex. Instead of creating simple sums or averages on a column in a report (e.g., expenses) they want to extract subsets of data from the column and show them next to each other on the same report (e.g., separate expense columns for acquisition expenses, delivery expenses, and customer service expenses), each with individual subtotals. In fact, if you look at your power users’ desktops, you will likely find that users have been deconstructing some of the data they downloaded from the data warehouse. Two common examples center on financial data:
- Expense data. This generally includes expense types such as purchase dollars, servicing dollars, waiver amounts, fees, and taxes. Although each transaction is a separate row in the data warehouse, the business community wants the transaction amount displayed by its expense type with running totals across the row, not just totaled at the end of the group or page.
- Calculations. Left to their own devices, the business community will create multiple versions of expense subtotals, resulting in calculations that have the same label but different values. For example, one functional area will create a “pure” expense total of direct costs while another will include indirect costs in the expense total. When they have the same label, the business community will create more than one version of the truth.
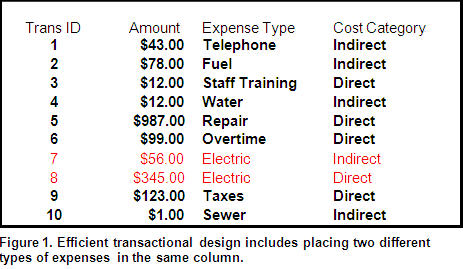
What, then, is the solution? If power users are deconstructing their data sets, it’s time to consider exposing additional columns of data to the business community. For example, your transactional system may be efficient in storing expense data, but that probably includes storing electric expense (Trans IDs 7 and 8) in the same amount column regardless of cost category type (see Figure 1).
(Click to enlarge)
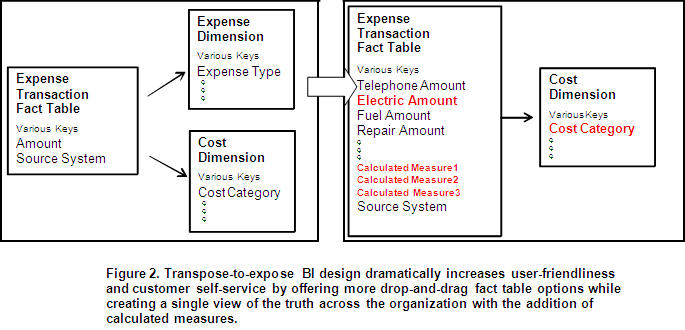
If your business intelligence (BI) solution brings this expense data into the data warehouse as is, then getting to specific amounts by expense type or by cost category is going to be a painful and tedious process for both IT and business power users. Instead, use the back-end ETL process to expose the value of the data to the business community. A simplified model conversion might look like Figure 2:
(Click to enlarge)
Your business users will love the idea. How, then, to handle the IT objections? Continually evaluate the richness of the data and the user self-service capability against the design trade-offs. The two most common objections are that it will consume more disk space and add heavy lifting to the ETL process.
Although your database administrator may be concerned that the BI solution model will create “Swiss cheese” in the columns, the extra space consumed by the database is a small price to pay for users accessing their own data and--more important--the vast improvement in the richness of the BI data.
If you encounter objections to converting rows to columns, your ETL team may be concerned about getting the design right. This is especially likely if they already created a data warehouse that mimics the transaction system layout. ETL processing for a transpose-to-expose design is not a simple suck-and-plunk from the transaction system--instead, the design needs to transpose rows to columns and add authoritative calculations so the organization truly has one source of the truth. In this case, you might need to consider using outside expertise to help with the design and minimize the implementation timeline.
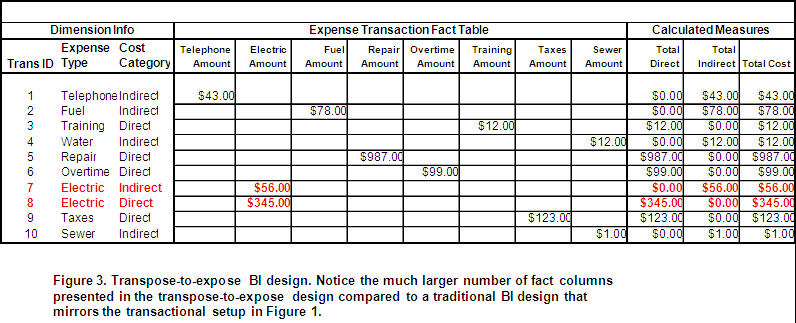
Best-practice design for analytical richness and user self-service calls for the ETL process to provide value-added information to the BI solution. The final cube for our example may look something like Figure 3. Pay special attention to the electric expense (Trans IDs 7 and 8), which has two different cost categories.
(Click to enlarge)
As part of the implementation game plan, your CIO should insist that the business community create authoritative versions of each calculation. While users certainly may have separate total calculations, they will need to create unique names to avoid confusion and identify the exact calculations used in each report. An authoritative data dictionary combined with a transpose-to-expose design creates a deep, rich data set for the business community. It is not unusual for business users to create 20 sets of authoritative calculations from four to eight different expense types or cost categories embedded in a single column of data!
With the calculations stored as drop-and-drag variables in the cubes and reporting model, everyone is able to build individual ad hoc reports without IT intervention. Exposing the full breadth of the data to the right users allows these users to quickly find the anomalies and drill straight through to the problems for immediate corrective action.
Christina Rouse, Ph.D., is chief architect for Incisive Analytics LLC. An improvement catalyst, Chris applies business intelligence strategy for performance improvement. Leveraging two decades of data experience on a broad range of technical platforms, she developed a technology-agnostic approach to business intelligence consulting.
Janet Kuster, MBA, PMP, is the delivery manager for Incisive Analytics LLC. Janet ensures high-quality delivery on all client projects. Her collaborative and diplomatic style enables her to deliver excellent product value and achieve superior knowledge transfer in organizations focused on innovation and performance improvement.

Quality Assurance Testing: The Secret Weapon of Data Governance
John O’Brien
CONNECT: The Knowledge Network
Topics:
Quality Assurance, Data Governance
Many business intelligence (BI) teams have difficulty executing the necessary quality assurance (QA) testing on their BI products and deliverables. QA resources are already lean and schedules inevitably become compressed when data complexity and changing business requirements arise. As a result, we often fail to accomplish the level of quality testing we set for ourselves.
The impact of poor testing is shared with business partners, and we accept the risk in the production environment with a promise that any defects will be quickly addressed. Unfortunately, this ineffective process is repeated when we move on to the next project.
This is hardly a revelation for most of us. In fact, many BI environments lack comprehensive testing, which leads to uncertainty about data-driven decisions. In some part, data governance programs are being established to address this apprehension about the reliability of information.
Let’s explore a new QA testing approach that BI teams are exploiting today. This paradigm shift complements traditional testing methods and results in a far greater level of QA testing. This is the concept of “test the data as a means of testing the code.”
The basic building block of data integration projects is source-to-target data transformation, such as operational systems to a staging layer, staging to integrated subject areas, or subject areas to dimensional marts. Depending on the data architecture of your BI platform, you will have these blocks throughout the data warehouse with various transformations to test. Using each of the transformation rules, you can leverage the data to test the quality of the code and requirement captured.
For each transformation rule, the developer writes code based on the design specifications and business rules. Capturing these rules as metadata using common tools such as spreadsheets or exports from data modeling tools is the first step in the automation of QA testing.
This QA technique will inspect the input data from the ETL source data location and inspect and output data from the ETL target data location based on the business rules that are stored as metadata. Database procedures that read the metadata business rules for each mapping will generate the SQL statements that the test team runs for the inspection. Typically, these are fairly complex and time consuming to correctly generate and update. The business rules for each transformation can test for conditions such as domain ranges, truncations, missed codes, or referential integrity.
The output of the SQL statements is then stored in a test results metadata table for the tester to review and report on each test cycle. This approach will verify that all possible input and output data is accounted for in the ETL code. Input data includes source systems, staging areas, and data warehouse hubs, and output data includes staging areas, data warehouse hubs, and data marts.
When an inconsistency is discovered, you can quickly determine whether the ETL is deficient or correctly coded to inaccurate or incomplete business logic. Utilizing production data extracts for testing can involve tens or hundreds of thousands of records to be transformed per test cycle and will quickly have every record accounted for with no outliers lost.
Metadata as part of the strategy is a key component of data governance programs, and this provides BI teams the opportunity to enhance or jump-start their data governance program value without much additional effort. This QA approach will leverage metadata in three forms:
- Capturing the data transformation rules between layers within the BI architecture
- Executing the SQL scripts in production every refresh cycle to quickly identify any changes in operational data or business processes
- Data warehouse quality metrics are based on how many records pass or fail the coded business rules and are represented to users as a “data governance dashboard”
If you start delivering this information as a side dish to your data warehouse, business users will have more confidence to make critical business decisions because of the transparency you have provided. New BI projects will leverage and easily extend the repository of QA tests for a very agile QA program--or should we say data governance program?
John O’Brien, CBIP, is the CTO and solutions architect of CONNECT: The Knowledge Network. As a recognized BI thought leader and 20-year industry veteran, John is frequently interviewed, published, and invited to speak at worldwide BI events about the future of BI architectures, data, trends and technologies.

Highlight of key findings from TDWI's wide variety of research
Data Warehouse Options
BW sounds appealing, but do SAP customers use it? To answer this question and quantify BW’s adoption rate, TDWI asked: “Has your organization evaluated SAP NetWeaver BI (or BW)?” (See Figure 13.) Thirty percent of respondents (who are all SAP application users) have already deployed NetWeaver BI including BW, while another 21% are implementing it now, and 8% will implement it in the future. Totaling these shows that 59% of SAP users surveyed have made a commitment to NetWeaver BI with BW, which is a high adoption rate for a BI product from an applications vendor.
A mere 6% of respondents evaluated but then rejected BW, while 5% don’t plan to evaluate it.
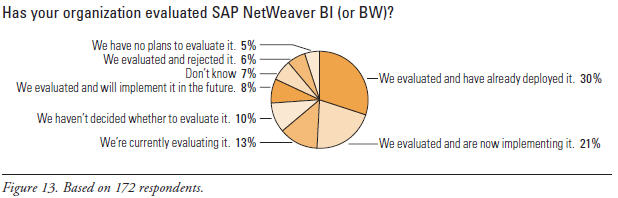
Source: Business Intelligence Solutions for SAP (TDWI Best Practices Report, Q4 2007). Click here to access the report.

FlashPoint Rx prescribes a "Mistake to Avoid" for business intelligence and data warehousing professionals.
Mistake:
Treating Data Governance as Luxury, Not Necessity
By Jill Dyche and Evan Levy, Baseline Consulting
Data warehousing and business intelligence professionals are often at the forefront of the data governance debate. Indeed, the data warehouse is often the only platform that intermingles heterogeneous data from across different organizations and systems, creating the need for tiebreaking and policy-making.
We define data governance as the framework, processes, and oversight for establishing policies and definitions for corporate data. Data governance puts structure around the decision-making process that prioritizes investments, allocates resources, and monitors results to ensure that the data being managed and deployed on projects is aligned with corporate objectives, supports desirable business actions and behaviors, and creates value. While this is great for a BI program, it’s absolutely critical for master data management.
Data governance involves management in IT as well as the lines of business coming together on a consistent basis to establish the policies, guidelines, and definitions for master data. Such decisions ultimately inform what the customer master record contains, and how reliable and useful it is to the various business applications that access it. (We distinguish data governance and data management, the latter being the day-to-day tactics of ensuring integrated, accurate, and defined enterprise data.)
For instance, at a large phone company we work with, the operations group focuses on the customer’s phone number. When the customer needs service, operations focuses on the customer’s physical address. Conversely, the finance organization wants to know who’s responsible for paying the bill, regardless of where the phone line goes. Finance doesn’t care about who uses the phone or data line. At this company, the “user” and the “payer” are frequently different people.
Both operations and finance use the term customer to mean something different. Resolving the definition of customer is not the responsibility of the CDI hub--it’s a business decision. The data governance committee arbitrates the differences between these two “customers,” and determines how they should be supported, ensuring that both organizations’ needs are met.
A key point here is that data governance shouldn’t concern itself with data storage, but with how the data is processed and used. Data governance is important because it focuses on the usage of data in the business--ensuring that sustained, meaningful, and accurate data isn’t just a goal, but a practice. Master data initiatives like CDI serve as just the pretext for launching a formal and sustained data governance program on behalf of the entire enterprise.
Source: Ten Mistakes to Avoid When Planning Your CDI/MDM Project (Q3 2006). Click here to access the publication.

