


February 4, 2010
ANNOUNCEMENTS
TDWI Members receive a $275 discount on the price of registration for the TDWI World Conference Las Vegas, February 21-26. Register here.
CONTENTS

Data Migration Information Integrity
The Starting Point of Data Quality: Baseline Data Quality Metrics

Reporting and Analysis Tools from SAP and Third-Party Vendors

Mistake: Overemphasizing Metadata

See what's
current in TDWI Education, Research, Webinars, and Marketplace
Data Migration Information Integrity
Todd Saunders
CONNECT: The Knowledge Network
Topic:
Data Migration
Business intelligence and data warehousing (BI/DW) solutions are constantly changing. One prevalent cause is the addition of new data into the DW. New data may be needed for many reasons, including the integration of data from a newly acquired company, introduction of a new data source, or implementation of a new data strategy. It is vital that the changes occur without impacting the integrity of the existing DW information.
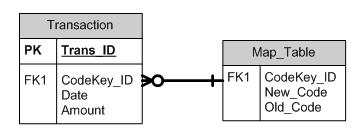
There are a number of options for modifying a DW solution when introducing a new coding scheme. The scheme could reference raw materials in a manufacturing company, inventory items in a distribution company, or disease classification in a healthcare organization. Additionally, the scheme may include changes to both the format of the code as well as the taxonomy and classification hierarchy in the code set. Although many operational and procedural changes are typically required to accommodate this type of change, we will focus on the handling of the data within the DW environment.
Some questions that arise under these circumstances include:
- What is the impact to the data model?
- What structural changes should be made to the DW?
- Is it necessary to maintain both code sets? For how long?
- What is the mapping between the two code sets? What happens when there is no appropriate mapping?
- What else changes if the categories, groupings, and hierarchy are different?
- How do we handle historical analysis that spans the cutover date?
- What should we do with all of our historical data?
- What are the impacts to our existing reports and queries?
As these questions indicate, moving to a new code set requires more than just modifying the format of the old code fields to handle the new format. However, let’s first focus on some options for handling the data in the DW.
Option 1: Modify Field Formats and Keep Both Code Sets
Identify all fields in all tables in the DW that contain the original code set and modify the format of fields to accommodate both the new and old codes. New codes are captured as of the cutover date.
Option 2: Modify Field Formats and Update All Old Codes
Same as Option 1, except all old codes are replaced with the new codes based on the agreed-upon mappings
Option 3: Add Additional Column for the New Code Set
Create a parallel column for the new code set in all tables containing the old code set. The new column is populated using the mapping table. New data added to the structure with the new set can also write the equivalent old code using the mapping table relationships. Each record is time-stamped with an effective date.
Option 4: Add Duplicate Tables for All Tables with the Old Code Set
Identify all fields in all tables in the DW that contain the original code set and duplicate those tables, with the exception that the new table has field formats that accommodate the new code set. This is similar to a horizontal partitioning of the data. The new tables are effective as of the cutover date and store only data using the new code set.
Option 5: Develop an Internal Surrogate Key
Identify all unique mappings between the old and new code sets and assign a unique key to each.
This new key is used in place of the other code set keys and can be referenced using the cross-reference mapping table. Most of these mappings will simply identify a one-to-one mapping between the old and new codes. However, this approach can also enable efficient management of the required one-to-many mappings that may appear.
The option you choose should be the one that has a reasonable cost and best accommodates the needs of the business in terms of time to implement and ease of use and maintenance. Options 1, 2, and 4 will present the most difficulty in dealing with the one-to-many mapping issues. Also, option 1 introduces the risk associated with having two code sets stored in one column, which can be misleading for those not intimately aware of the code and data structures. Options 3 and 4 make it clearer that two code sets exist in the environment, but there may still be difficulty with the one-to-many mappings. Option 5 offers the most flexibility while introducing the least amount of risk, but still requires a review of the mappings.
Todd Saunders is the executive vice president of customer solutions with CONNECT: The Knowledge Network, a consulting firm that specializes in data, technical, and organizational solutions for business intelligence. Todd can be reached at 303.730.7171, ext. 236.

The Starting Point of Data Quality:
Baseline Data Quality Metrics
Deanne Larson
Larson & Associates
Topics: Data Quality, Baseline Metrics
It is a new year and your resolution list is daunting. Where do you begin? The start of a new year is like the start of your data quality journey--you know you need to make changes, but you are unsure how to start. With data quality, the journey begins by examining the data you have: the data your users trust and the data your executives are using to make decisions.
What Is a Baseline Metric?
Baseline metrics record the current state of data and are taken at the start of an improvement effort (before solutions have been implemented). By quantifying the current level of data quality, perception is removed from the equation and the impartial starting point is established. Baseline metrics are used to determine where quality issues exist, assess the impact of those issues, and measure improvement after solutions have been implemented. Establishing baseline data quality metrics provides an understanding of the current level of data quality, which, in turn, provides insight into root causes and actions.
Establish Priorities for Baseline Metrics
It is not possible to create baseline data quality metrics for all of your organization’s data at once. Prioritizing your data will help define the starting point. Data can be prioritized by subject area or by attribute; however, the most beneficial approach is based on business criticality.
A quick way to assess the business criticality of data is to review the data lineage of your organization’s key performance indicators (KPIs). Indicators are made up of metrics, metrics are a collection of measures, and measures are composed of data attributes. The data attributes that align to KPIs are a high priority and could be a starting point. Business criticality is the best way to prioritize data for a quality assessment, as it defines the value of the data.
Profiling Data and Establishing the Baseline
Data profiling is a fundamental approach used to discover data content. Profiling can be used for other purposes, such as structure discovery (data patterns and metadata conformance) and relationship discovery (referential integrity and key uniqueness). However, the focus is on content discovery for baseline data quality metrics. Content discovery focuses on determining data completeness, accuracy, uniqueness, and conformity.
Data profiling tools will provide data demographics. Some of the common statistical information provided includes record count, minimum and maximum values, mean, mode, percentiles, frequency distribution, and standard deviation. These results are typically available for each attribute you profile. With this demographic information, content discovery transitions to analysis and establishing the baseline.
Examples of baseline data quality metrics that can be derived from data profile demographics include: percent complete, percent null, percent out of compliance, exception counts, exception values, range values, and out-of-range values. This is not an exhaustive list--these are just some of the common data quality issues discovered though content analysis.
Many of these examples can be converted into percentages, which make good baseline metrics. One of the simplest baseline metrics is percent complete. This metric provides insight into missing values, which can have a huge impact on KPI calculations. Once baseline metrics are established, root causes can be researched and solutions recommended. Root causes can sometimes be corrected upstream in the source or resolved through cleansing and transformation.
Benefits
The benefits of establishing baseline data quality metrics begin with removing perception from the data quality equation. Data is no longer categorized as “bad” or “good.” It becomes clear what quality issues are present. Finger-pointing between IT and business users ceases because the focus turns to establishing root cause and resolution. Resolutions to the root causes can foster teamwork between IT and business partners as business users decide what data issues are addressed and IT offers solutions.
Baseline metrics also remove assumptions from the requirement phase of the development cycle. Data is not assumed to be correct and is known by baseline values, which can be analyzed to determine the impact on ability to deliver the desired result. For example, if an attribute used to calculate a KPI is 78 percent complete, is it possible for IT to deliver the KPI? Can the business provide logic to populate the missing 22 percent? These issues are best discovered in the requirements phase versus the development phase of the life cycle. Finally, baseline data quality metrics provide the ability to demonstrate improvement. Once data transformation and cleansing are complete, you can establish new metrics. By establishing quality baselines on business-critical data, value is realized quickly, which is a great way to start the data quality journey.
Deanne Larson, CBIP, PMP, and DM (candidate), is the president of Larson & Associates. She has more than 18 years of BI/DW experience and has spoken nationally and internationally at industry conferences.

Highlight of key findings from TDWI's wide variety of research
Reporting and Analysis Tools from SAP and Third-Party Vendors
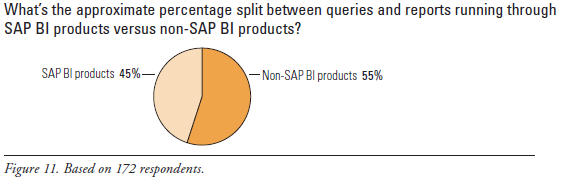
Which is used most: tools from SAP or those from other vendors? To quantify this, TDWI Research asked: “What’s the approximate percentage split between queries and reports running through SAP BI products versus non-SAP BI products?” (See Figure 11.) Non-SAP BI products edged ahead at 55% versus the 45% of SAP BI tools. The numbers are close enough that we should consider them tied. In other words, SAP users run roughly equivalent numbers of queries and reports through BI tools from SAP and other vendors, showing near-equal reliance on the two camps.
(Click to enlarge)
Source: Business Intelligence Solutions for SAP (TDWI Best Practices Report, Q4 2007). Click here to access the report.

FlashPoint Rx prescribes a "Mistake to Avoid" for business intelligence and data warehousing professionals.
Mistake:
Overemphasizing Metadata
By Mark Madsen, Third Nature, Inc.
Many ETL selections focus too much on the metadata components of the ETL product. Metadata use is implicit within the tool. Metadata accessibility, external integration, and reporting options are used less frequently outside the ETL environment than most people expect.
It is better to focus on the use of metadata within the development and maintenance environment. Can you see the impact of a potential source change across an extract or a set of extracts? Can you trace, in sequence, a value from the target column back through multiple sources? These are the features that are most likely to be used.
Features like end-user access to the repository or the ability to import metadata from multiple tools are generally not as important to the overall environment, unless you are doing an enterprise metadata project as part of your current project. By overemphasizing little-used features, you run the risk of choosing the wrong product.
Source: Ten Mistakes to Avoid When Selecting and Deploying ETL Tools (Q2 2006). Click here to access the publication.

