I’ve recently spent a lot of time talking to companies about how they’re using text analytics. By far, one of the biggest use cases for text analytics centers on understanding customer feedback and behavior. Some companies are using internal data such as call center notes or emails or survey verbatim to gather feedback and understand behavior, others are using social media, and still others are using both.
What are these end users saying about how to be successful with text analytics? Aside from the important best practices around defining the right problem, getting the right people, and dealing with infrastructure issues, I’ve also heard the following:
Best Practice #1 - Managing expectations among senior leadership. A number of the end-users I speak with say that their management often thinks that text analytics solutions will work almost out of the box and this can establish unrealistic expectations. Some of these executives seem to envision a big funnel where reams of unstructured text enter and concepts, themes, entities, and insights pop out at the other end. Managing expectations is a balancing act. On the one hand, executive management may not want to hear the details about how long it is going to take you to build a taxonomy or integrate data. On the other hand, it is important to get wins under your belt quickly to establish credibility in the technology because no one wants to wait years to see some results. That said, it is still important to establish a reasonable set of goals and prioritize them and to communicate them to everyone. End users find that getting senior management involved and keeping them informed with well-defined plans on a realistic first project can be very helpful in handling expectations.
Best Practice #2 – Manage expectations among business analysts (and statisticians). Most people who deal with text analysis believe that “looking at text data is very different than analyzing structured data.” It turns out that some analysts get uncomfortable when dealing with unstructured data because they’re used to building models with extremely high accuracy using well-understood structured data. The reality is that with unstructured text, you might only achieve 70-80 percent accuracy (for example, in sentiment analysis). Therefore, these analysts need to enter into the analysis with their eyes open to this ambiguity and decide what they can live with in terms of analysis. End-users I’ve spoken to say that this can take a little time and patience, but with some education, it does work.
Best Practice #3- Keep it visible. I have spoken with a number of companies that understand that in order for text analytics to keep a seat at the (executive) table it is important to keep it front and center. How do they do this? Some companies distribute ongoing analysis while others distribute daily customer quotes from unstructured data sources. Many find that the emotion and feeling in customer feedback can really capture the attention of senior leadership. Other end-users have cited the ability to “tell the story” with your text data, and that story can be very powerful and provide visibility to the analysis.
Best Practice #4 -Dig, Dig, Dig. Dig deeper than just monitoring. Many companies start off with social media analysis as the first part of their text analytics journey. However, many social media analytics platforms are nothing more than listening posts that will give you some hint as to the buzz around your product and if it is positive or negative. At the end of the day, that doesn’t provide you with much information. They may be a good first step in getting your feet wet. However, companies that are successful in utilizing text analytics tools believe that they are just touching the tip of the iceberg in the kinds of analysis they can perform with a text analytics tool. They are integrating data sources (i.e. structured and unstructured) and digging deep into the data to determine the why around the what of certain issues. This means visualizing the data as well as utilizing more sophisticated methods to analyze it.
Best Practice # 5- Actionable feedback requires a way to take action. Text analytics can provide you with significant insight as to the “why” of a behavior. However, you need to be in a position to make it actionable if you want to derive the most benefits from the technology. For instance, you may determine that a group of customers are unhappy about a certain product or that a feature you provide isn’t meeting expectations and that is why they are no longer customers. That’s great insight, but you need to be able to act on it. Of course, action can come in a number of flavors. It can be as simple as having a manual process in place to deal with the insights. Or it can become more sophisticated. For example, some are operationalizing a process by using tools that help to close the loop with their customers by routing comments to agents who can then reach out to these customers.
Of course, many of these best practices are useful for any kind of advanced analytics. However, as text data takes its place in organizations, it is essential not to forget them. It is also important to remember that there are differences between analyzing and utilizing structured and unstructured data – a topic I will explore further in future posts.
Posted by Fern Halper, Ph.D. on February 14, 20130 comments
I am excited to join TDWI as the Research Director for Advanced Analytics. Of course, different people have different definitions for advanced analytics. Here’s how I define it. Advanced analytics provides algorithms for complex analysis of either structured or unstructured data. It includes sophisticated statistical models, machine learning, neural networks, text analytics and other advanced data mining techniques. Among its many use cases, it can be deployed to find patterns in data, prediction, optimization, forecasting, and stream mining. It typically does not include simple database query and reporting or OLAP cubes.
Clearly, big data and advanced analytics are becoming increasingly interconnected. The development of big data analytics has been driven by scientific research, the needs of Internet giants, and the requirements of large multi-national companies. However, more and more, organizations are realizing that big data -- both in-house, or that they can obtain from external sources -- might provide very valuable insight. Until recently, though, it was difficult to glean insight from this data because of cost, infrastructure, algorithmic, and other issues.
Many companies are interested in big data analytics but don’t know where to start. Others are early in their big data deployments and want to understand what they should be doing next. Therefore, one of the first projects I’m working on at TDWI is a Big Data Analytics Maturity Model. The maturity framework is divided into five categories, each with a series of subcategories and questions associated with those subcategories. For example, one category examines how organizational factors such as strategy, leadership, skills, funding, and culture play into your maturity in terms of big data analytics. Other categories examine factors related to infrastructure, data, analytics, and governance. All of this is related to best practices.
Since I just finished co-authoring Big Data for Dummies, this is a great project for me as I begin my career at TDWI. Please stay tuned!
Any thoughts, please let me know!
Posted by Fern Halper, Ph.D. on February 6, 20130 comments
Happy New Year to the TDWI Community! As we head into 2013, it’s clear that organizations will continue to face unpredictable economic currents and regulatory pressures, and will require better intelligence and faster decision processes. TDWI has just published a new Best Practices Report that I wrote, “Achieving Greater Agility with Business Intelligence.” This report focuses on how organizations can develop and deploy BI, analytics, and data warehousing to improve flexibility and decision-making speed. I hope you can attend our upcoming Webinar presentation of the report, to be held on January 15, which will look in-depth at the research findings and offer best practices recommendations for increasing agility.
Three key areas of innovation in technologies and practices that I covered in the report will clearly be important as organizations aim for higher agility in 2013. These include the following:
Managed, self-service BI and analytic data discovery of structured and unstructured data: Decision makers are demanding tools that will allow them to access, analyze, profile, cleanse, transform, and share information without having to wait for IT. They will need access to more than just historical, structured data found in traditional systems. Unified access to both structured and unstructured data is growing in importance as decision makers seek to perform complete, context-rich analysis against big data.
New data warehousing and integration options, including virtualization: Data integration can be the source of challenging and expensive problems. Organizations are evaluating the range of options, including data federation and virtualization, that can give users managed self-service. These could allow users to work more iteratively with IT to create comprehensive views of data in place without having to physically extract and move it into an application, data mart, or specialized data store.
Agile development methods: The use of agile methods, now a mainstream trend in software development, is having an increasing impact on BI and data warehousing. Organizations are proving that they by implementing Scrum and other techniques, they can remove a good deal of the wait and waste of traditional development processes.
In the report, we found that most organizations regard their agility – that is, their ability to adjust to change and take advantage of emerging opportunities – and merely “average.” No doubt, organizations seeking new competitive advantages in 2013 will demand better than that. They will be looking to their BI, analytics, and data warehousing systems to help them become reach a higher level of agility.
Posted by David Stodder on January 7, 20130 comments
Blog by Philip Russom
Research Director for Data Management, TDWI
To help you better understand High-Performance Data Warehousing (HiPerDW) and why you should care about it, I’d like to share with you the series of 34 tweets I recently issued. I think you’ll find the tweets interesting, because they provide an overview of HiPerDW in a form that’s compact, yet amazingly comprehensive.
Every tweet I wrote was a short sound bite or stat bite drawn from my recent TDWI report on HiPerDW. Many of the tweets focus on a statistic cited in the report, while other tweets are definitions stated in the report.
I left in the arcane acronyms, abbreviations, and incomplete sentences typical of tweets, because I think that all of you already know them or can figure them out. Even so, I deleted a few tiny URLs, hashtags, and repetitive phrases. I issued the tweets in groups, on related topics; so I’ve added some headings to this blog to show that organization. Otherwise, these are raw tweets.
Defining High-Performance Data Warehousing (#HiPerDW)
1. The 4 dimensions of High-Performance Data Warehousing (#HiPerDW): speed, scale, complexity, concurrency.
2. High-performance data warehousing (#HiPerDW) achieves speed & scale, despite complexity & concurrency.
3. #HiPerDW 4 dimensions relate. Scaling requires speed. Complexity & concurrency inhibit speed & scale.
4. High-performance data warehousing (#HiPerDW) isn't just DW. #BizIntel, #DataIntegration & #Analytics must also perform.
5. Common example of speed via high-performance data warehousing (#HiPerDW) = #RealTime for #OperationalBI.
6. A big challenge to high-performance data warehousing (#HiPerDW) = Scaling up or out to #BigData volumes.
7. Growing complexity & diversity of sources, platforms, data types, & architectures challenge #HiPerDW.
8. Increasing concurrency of users, reports, apps, #Analytics, & multiple workloads also challenge #HiPerDW.
HiPerDW Makes Many Applications Possible
9. High-performance data warehousing (#HiPerDW) enables fast-paced, nimble, competitive biz practices.
10. Extreme speed/scale of #BigData #Analytics requires extreme high-performance warehousing (#HiPerDW).
11. #HiPerDW enables #OperationalBI, just-in-time inv, biz monitor, price optimiz, fraud detect, mobile mgt.
HiPerDW is An Opportunity
12. #TDWI SURVEY SEZ: High-performance data warehousing (#HiPerDW) is mostly opportunity (64%); sometimes problem (36%).
13. #HiPerDW is an opportunity because it enables new, broader and faster data-driven business practices.
14. #TDWI SURVEY SEZ: 66% say High Perf #DataWarehousing (#HiPerDW) is extremely important. 6% find it a non-issue.
15. #TDWI SURVEY SEZ: Most performance improvements are responses to biz demands, growth, or slow tools.
New Options for HiPerDW
16. Many architectures support High-Perf #DataWarehousing (#HiPerDW): MPP, grids, clusters, virtual, clouds.
17. #HiPerDW depends on #RealTime functions for: streaming data, buses, SOA, event processing, in-memory DBs.
18. Many hardware options support #HiPerDW: big memory, multi-core CPUs, Flash memory, solid-state drives.
19. Innovations for Hi-Perf #DataWarehousing (#HiPerDW) = appliance, columnar, #Hadoop, #MapReduce, InDB #Analytics.
20. Vendor tools are indispensible, but #HiPerDW still requires optimization, tweaks & tuning by tech users.
Benefits and Barriers for HiPerDW
21. #TDWI SURVEY SEZ: Any biz process or tech that’s #Analytics, #RealTime or data-driven benefits from #HiPerDW.
22. #TDWI SURVEY SEZ: Biggest barriers to #HiPerDW are cost, tool deficiencies, inadequate skills, & #RealTime.
Replacing DW to Achieve HiPerDW
23. #TDWI SURVEY SEZ: 1/3 of users will replace DW platform within 3 yrs to boost performance. #HiPerDW
24. #TDWI SURVEY SEZ: Top reason to replace #EDW is scalability. Second reason is speed. #HiPerDW
25. #TDWI SURVEY SEZ: The number of analytic datasets in 100-500+ terabyte ranges will triple. #HiPerDW
HiPerDW Best Practices
26. #TDWI SURVEY SEZ: 61% their top High-Performance DW method (#HiPerDW) is ad hoc tweaking & tuning.
27. #TDWI SURVEY SEZ: Bad news: Tweaking & tuning for #HiPerDW keeps developers from developing.
28. #TDWI SURVEY SEZ: Good news: Only 9% spend half or more of time tweaking & tuning for #HiPerDW.
29. #TDWI SURVEY SEZ: #HiPerDW methods: remodeling data, indexing, revising SQL, hardware upgrade.
30. BI/DW team is responsible for high-performance data warehousing (#HiPerDW), then IT & architects.
HiPerDW Options that will See Most Growth
31. #HiPerDW priorities for hardware = server memory, computing architecture, CPUs, storage.
32. #TDWI SURVEY SEZ: In-database #Analytics will see greatest 3-yr adoption among #HiPerDW functions.
33. #TDWI SURVEY SEZ: Among High-Perf #DataWarehouse functions (#HiPerDW), #RealTime ones see most adoption.
34. #TDWI SURVEY SEZ: In-memory databases will also see strong 3-yr growth among #HiPerDW functions.
FOR FURTHER STUDY:
For a more detailed discussion of High-Performance Data Warehousing (HiPerDW) – in a traditional publication! – see the TDWI Best Practices Report, titled “High-Performance Data Warehousing,” which is available in a PDF file via download.
You can also register for and replay my TDWI Webinar, where I present the findings of the TDWI report on High-Performance Data Warehousing (HiPerDW).
If you're not already, please follow me as @prussom on Twitter.
Posted by Philip Russom, Ph.D. on October 26, 20120 comments
By Philip Russom, TDWI Research Director
[NOTE -- My new TDWI report about High-Performance Data Warehousing (HiPer DW) is finished and will be published in October. The report’s Webinar will broadcast on October 9, 2012. In the meantime, I’ll leak a few of the report’s findings in this blog series. Search Twitter for #HiPerDW to find other leaks. Enjoy!]
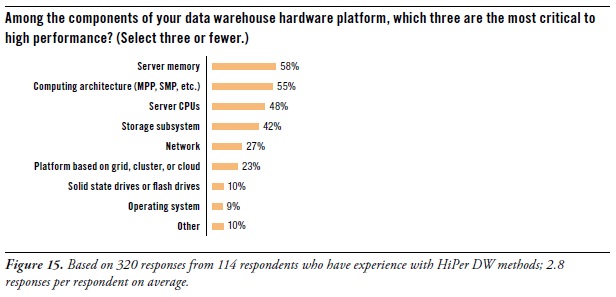
Let’s focus for a moment on the hardware components of a data warehouse platform. After all, many of the new capabilities and high performance of data warehouses come from recent advances in computer hardware of different types. To determine which hardware components contribute most to HiPer DW, the survey asked: “Among the components of your data warehouse hardware platform, which three are the most critical to high performance?” (See Figure 15. [shown above])
You may notice that the database management system (DBMS) is omitted from the list of multiple answers for this question. That’s because a DBMS is enterprise software, and this question is about hardware. However, let’s note that – in other TDWI surveys – respondents made it clear that they find the DBMS to be most critic component of a DW platform, whether for high performance, data modeling possibilities, BI/DI tool compatibility, in-database processing logic, storage strategies, or administration.
Performance priorities for hardware are server memory, computing architecture, CPUs, and storage.
Server memory topped respondents’ lists as most critical to high performance (58% of survey respondents). Since 64-bit computing arrived ten years ago, data warehouses (like other platforms in IT) have migrated away from 32-bit platform components, mostly to capitalize on the massive addressable memory spaces of 64-bit systems. As the price of server memory continues to drop, more organizations upgrade their DW servers with additional memory; 256 gigabytes seems common, although some systems are treated to a terabyte or more. To a lesser degree, users are also upgrading ETL and EBI servers. “Big memory” speeds up complex SQL, joins, and analytic model rescores due to less I/O to land data to disk.
Computing architecture (55%) also determines the level of performance. In other TDWI surveys, respondents have voiced their frustration at using symmetrical multi-processing systems (SMP), which were originally designed for operational applications and transactional servers. The DW community definitely prefers massively parallel processing (MPP) systems, which are more conducive to the large dataset processing of data warehousing.
Server CPUs (48%) are obvious contributors to HiPer DW. Moore’s Law once again takes us to a higher level of performance, this time with multi-core CPUs at reasonable prices.
We sometimes forget about storage (42%) as a platform component. Perhaps that’s because so many organizations now have central IT departments that provide storage as an ample enterprise resource, similar to how they’ve provided networks for decades. The importance of storage grows as big data grows. Luckily, storage has kept up with most of the criteria of Moore’s Law, with greater capacity, bandwidth, reliability, and capabilities, while also dropping in price. However, disk performance languished for decades (in terms of seek speeds), until the recent invention of solid-state drives, which are slowly finding their way into storage systems.
USER STORY -- Caching OLAP cubes in server memory provides high-performance drill down. “Within our enterprise BI program, we have business users who depend on OLAP-based dashboards for making daily strategic and tactical decisions,” said the senior director of BI architecture at a media firm. “To enable drill down from management dashboards into cube details, we maintain cubes in server memory, and we refresh them daily. We’ve only been doing this a few months, as part of a pilot program. The performance is good, and we received very positive feedback from the users. So it looks like we’ll do this for other dashboards in the future. To prepare for that eventuality, we just upgraded the memory in our enterprise BI servers.”
On a related topic, one of the experts interviewed for this report had this to add: “As memory chip density increases, the price comes down. Price alone keeps most server memory down to one terabyte or less today. But multi-terabyte server memory will be common in a few years.”
Want more? Register for my HiPer DW Webinar, coming up Oct.9 noon ET.
Read other blogs in this series:
Reasons for Developing HiPer DW
Opportunities for HiPer DW
The Four Dimensions of HiPer DW
Defining HiPer DW
High Performance: The Secret of Success and Survival
Posted by Philip Russom, Ph.D. on October 5, 20120 comments
By Philip Russom, TDWI Research Director
[NOTE -- My new TDWI report about High-Performance Data Warehousing (HiPer DW) is finished and will be published in October. The report’s Webinar will broadcast on October 9, 2012. In the meantime, I’ll leak a few of the report’s findings in this blog series. Search Twitter for #HiPerDW to find other leaks. Enjoy!]
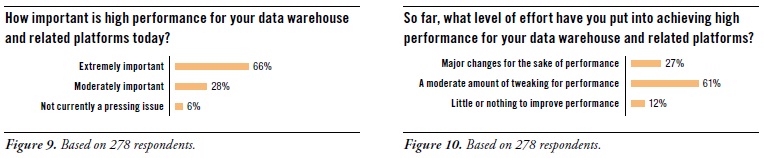
No one denies that HiPer DW is important. (See Figure 9. [shown above]) Two thirds of survey respondents called it extremely important (66%), while a quarter called it moderately important (28%). A mere 6% said that HiPer DW is not currently a pressing issue.
The wide majority of users surveyed are doing something about it. (See Figure 10. [shown above]) Luckily, most organizations can achieve their performance goals with a moderate amount of tweaking (61%). Even so, others have made major changes for the sake of performance (27%). Given that a third of user organizations are contemplating a change of platform to gain higher performance (as seen in Figure 7 [not shown in this blog]), more major changes are coming.
Whether major changes or moderate tweaking, there is a fair amount of work being done for the performance optimization of BI/DW/DI and analytic systems. To find out why, the survey asked: “Why do you need to invest time and money into performance enhancements?” (See Figure 11. [not shown in this blog])
Business needs optimal performance from systems for BI/DW/DI and analytics. This is clear from survey responses, such as: business practices demand faster and bigger BI and analytics (68%) and business strategy seeks maximum value from each system (19%). On the dark side of the issue, it’s sometimes true that [business] users’ expectations of performance are unrealistic (9%). In a similar vein, one response to “Other” said that “regulatory requirements demand timely reporting.”
Keeping pace with growth is a common reason for performance optimization. Considerable percentages of the experienced users responding to this survey question selected growth-related answers, such as scaling up to large data volumes (46%), scaling to greater analytic complexity (32%), and scaling to larger user communities with more reports (25%).
One way to keep pace with growth is to upgrade hardware. This is seen in the following responses: We keep adding more data without upgrading hardware (14%), and we keep adding users and applications without upgrading hardware (8%). Another way to put it is that adding more and heftier hardware is a tried-and-true method of optimization, though – when taken to extremes – it raises costs and dulls optimization skills.
Performance optimization occasionally compensates for tool deficiencies. Luckily, this is not too common. Very few respondents reported tool-related optimizations, such as: our BI and analytic tools are not high performance (15%), our database software is not high performance (6%), our BI and analytic tools do not take advantage of database software (4%), and our database software does not have features we need (3%). In other words, tools and platforms for BI/DW/DI and analytics perform adequately for the experienced users surveyed here. Their work in performance optimization most often targets new businesKeeping pace with growth is a common reason for performance optimization.s requirements and growing volumes of data, reports, and users – not tool and platform deficiencies.
EXPERT COMMENT -- Query optimizers do a lot of the work for us.
A database expert interviewed for this report said: “The query optimizer built into a vendor’s database management system can be a real life saver. But there’s also a lot of room for improvement. Most optimizers work best with well-written queries of modest size with predictable syntax. And that’s okay, because most queries fit that description today. However, as a wider range of people get into query-based analytics, query optimizers need to also improve poorly written queries. These can span hundreds of lines of complex SQL, with convoluted predicate structures, due to ad hoc methods, calling out to non-SQL procedures, or by mixing SQL from multiple hand-coded and tool-generated sources.”
Want more? Register for my HiPer DW Webinar, coming up Oct.9 noon ET.
Read other blogs in this series:
Opportunities for HiPer DW
The Four Dimensions of HiPer DW
Defining HiPer DW
High Performance: The Secret of Success and Survival
Posted by Philip Russom, Ph.D. on September 28, 20120 comments