The Big Data Maturity Model and Assessment is set to launch on November 20th. Krish Krishnan and I have been working on this for a while, and we’re very excited about it.
As I mentioned in my previous blog post (see previous post, below), there are two parts to the Big Data Maturity Model and assessment tool. TDWI members will be getting an email about the assessment on November 20th. We urge you to take the assessment and see where you land relative to your peers regarding your big data efforts. Additionally, it’s important to note that we view this assessment as evolutionary. We know that many companies are in the early stages of their big data journey. Therefore, this assessment is meant to be evolutionary. You can come back and take it more than once. In addition, we will be adding best practices as we learn more about what companies are doing to succeed in their big data efforts.
In the course of our research for the model, Krish and I spoke to numerous companies embarking on big data. There were some patterns that emerged regarding how companies get started in their big data efforts. Here are a few of them:
- Large volumes of structured data are already being analyzed in the company. Some companies have amassed large volumes (i.e., terabytes) of structured data that they are storing in their data warehouse or in some sort of appliance, often on-premises. They feel that their BI infrastructure is pretty solid. Typically, the BI effort is departmental in scope. Some of these companies are already performing more advanced kinds of analysis; such as predictive analytics on the data. Often, they are doing this to understand their customers. The vision for big data is about augmenting the data they have with other forms of data (often text or geospatial data) to gain more insight.
- A specific need for big data. Some companies start a big data effort, almost from scratch, because of a specific business need. For instance, a wireless provider might be interested in monitoring the network and then predicting where failures will occur. An insurance company might be interested in telemetric information in order to determine pricing for certain kinds of drivers. A marketing department might be interested in analyzing social media data to determine brand reputation or as part of a marketing campaign. Typically these efforts are departmental in scope and are not part of a wider enterprise big data ecosystem.
- Building the business on big data. We spoke to many e-businesses that were building the business model on big data. While these companies might be somewhat advanced in terms of infrastructure to support big data often they were still working on the analytics related to the service and typically did not have any form of governance in place.
Remember to check your email!
Posted by Fern Halper, Ph.D. on November 18, 20130 comments
We are getting ready to launch the TDWI Big Data Maturity Model and assessment tool in the next few weeks. We’re very excited about it, as it has taken a number of months and a lot of work to develop. There are two parts to the Big Data Maturity Model and assessment tool. The first is the actual TDWI Big Data Maturity Model Guide. This is a guide that walks you through the actual stages of maturity for big data initiatives and provides examples and characteristics of companies at different stages of maturity. In each of these stages, we look across various dimensions that are necessary for maturity. These include organizational issues, infrastructure, data management, analytics, and governance.
The second piece is the assessment tool. The tool allows respondents to answer a series of about 50 questions in the organization, infrastructure, data management, analytics, and governance dimensions. Once complete, the respondent receives a score in each dimension as well as some expectations and best practices for moving forward. A unique feature of the assessment is that respondents can actually look to see how their scores compare against their peers, by both industry and company size.
At the same time we’ve been building the Big Data Maturity Model, I’ve also been working on the predictive analytics Best Practices Report. Since no survey about analytics would be complete without some questions about big data, I did include a section about it in the survey. Interestingly, over 70% of the respondents actively using predictive analytics or planning to use it (242 respondents) from the survey claim to have some sort of big data push going on in their organization.
The group also reported a series a challenges (seen in the figure, below).
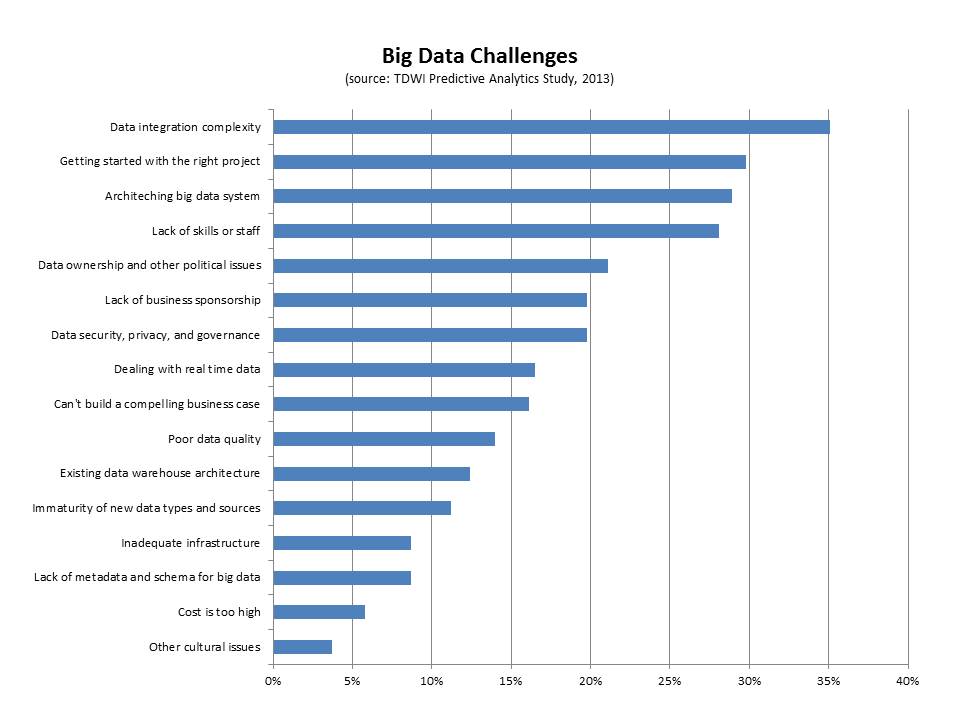
- Data integration. The top challenge cited by this group of respondents was big data integration (35%). Interestingly, if you look only at those respondents who are current users of predictive analytics and users of big data, 44% report this as the top challenge. Clearly, integrating disparate kinds of data from different sources is difficult. We saw this in our interviews for the big data maturity model. For instance, despite having some sort of data warehouse (especially in the case of the enterprise), a nascent organization in terms of big data maturity will often have also collected data as files with different formats, but without naming standards, and with storage structures that are minimally defined. This data is not integrated.
- Getting started with the right project. This is a key challenge that companies face when getting started with big data. Thirty percent of the respondents in this group cited it as a top challenge. We note this in the maturity model as well as a pre-adoption issue. Typically, there might be a team charged with exploring big data that is trying to determine the top business problems to solve. Identifying the right business problem is critical for success and business needs to get involved as quickly as possible.
- Architecting a big data system. Big data can mean disparate kinds of high-volume and high-frequency data. Architecting a system is important for success and it can be difficult. Twenty-nine percent of the respondents cited this as a challenge. The end goal for an architecture is frequently some sort of big data ecosystem that contains a unified information architecture which underpins analytics. Getting there can involve surgical precision in terms of rolling out infrastructure.
- Lack of skills or staff. Twenty-eight percent of respondents cited this as a top challenge. This is a key challenge, whether it is the skills for Hadoop or other big data infrastructure or the analytics skills required to make sense of big data. Different organizations approach the skills issue in different ways. Some hire externally or look for university hires. Others try to re-train from within. Still others look to cross-pollinate skills from one part of the organization to a team that utilizes new technologies. Some build centers of excellence that help with the training from within. Others form SWOT-type teams to address big data analytics.
Look out for e-mails and other materials over the next few weeks letting you know that the Big Data Maturity Model and assessment tool are live!
Posted by Fern Halper, Ph.D. on October 29, 20130 comments
By Philip Russom
Research Director for Data Management, TDWI
To help you better understand new practices for managing big data and why you should care, I’d like to share with you the series of 30 tweets I recently issued on the topic. I think you’ll find the tweets interesting, because they provide an overview of big data management and its best practices in a form that’s compact, yet amazingly comprehensive.
Every tweet I wrote was a short sound bite or stat bite drawn from my recent TDWI report “Managing Big Data.” Many of the tweets focus on a statistic cited in the report, while other tweets are definitions stated in the report.
I left in the arcane acronyms, abbreviations, and incomplete sentences typical of tweets, because I think that all of you already know them or can figure them out. Even so, I deleted a few tiny URLs, hashtags, and repetitive phrases. I issued the tweets in groups, on related topics; so I’ve added some headings to this blog to show that organization. Otherwise, these are raw tweets.
Types of Multi-Structured Data Managed as Big Data
1. #TDWI SURVEY SEZ: 26% of users manage #BigData that’s ONLY structured, usually relational.
2. #TDWI SURVEY SEZ: 31% manage #BigData that’s eclectic mix of struc, unstruc, semi, etc.
3. #TDWI SURVEY SEZ: 38% don’t have #BigData by any definition. Hear more in #TDWI Webinar Oct.8 noonET http://bit.ly/BDMweb
4. Structured (relational) data from traditional apps is most common form of #BigData.
5. #BigData can be industry specific, like unstruc’d text in insurance, healthcare & gov.
6. Machine data is special area of #BigData, with as yet untapped biz value & opportunity.
Reasons for Managing Big Data Well
7. Why manage #BigData? Keep pace w/growth, biz ROI, extend ent data arch, new apps.
8. Want to get biz value from #BigData? Manage #BigData for purposes of advanced #analytics.
9. #BigDataMgt yields larger samples for apps that need it: 360° views, risk, fraud, customer seg.
10. #TDWI SURVEY SEZ: 89% feel #BigDataMgt is opportunity. Mere 11% think it’s a problem.
11. Key benefits of #BigDataMgt are better #analytics, datasets, biz value, sales/marketing.
12. Barriers to #BigDataMgt: low maturity, weak biz support, new design paradigms.
13. #BigDataMgt non-issues: bulk load, query speed, scalability, network bandwidth.
Strategies for Users’ Big Data Management Solutions
14. #TDWI SURVEY SEZ: 10% have #BigDataMgt solution in production; 10% in dev; 20% prototype; 60% nada. #TDWI Webinar Oct.8 http://bit.ly/BDMweb
15. #TDWI SURVEY SEZ: Most common strategy for #BigDataMgt: extend existing DataMgt systems.
16. #TDWI SURVEY SEZ: 2nd most common strategy for #BigDataMgt: deploy new DataMgt systems for #BigData.
17. #TDWI SURVEY SEZ: 30% have no strategy for #BigDataMgt though they need one.
18. #TDWI SURVEY SEZ: 15% have no strategy for #BigDataMgt cuz they don’t need one.
Ownership and Use of Big Data Management Solutions
19. Some depts. & groups have own #BigDataMgt platforms, including #Hadoop. Beware teramart silos!
20. Trend: #BigDataMgt platforms supplied by IT as infrastructure. Imagine shared #Hadoop cluster.
21. Who does #BigDataMgt? analysts 22%; architects 21%; mgrs 21%; tech admin 13%; app dev 11%.
Tech Specs for Big Data Management Solutions
22. #TDWI SURVEY SEZ: 97% of orgs manage structured #BigData, followed by legacy, semi-struc, Web data etc.
23. Most #BigData stored on trad drives, but solid state drives & in-memory functions are gaining.
24. #TDWI SURVEY SEZ: 10-to-99 terabytes is the norm for #BigData today.
25. #TDWI SURVEY SEZ: 10% have broken the 1 petabyte #BigData barrier. Another 13% will within 3 years.
A Few Best Practices for Managing Big Data
26. For open-ended discovery-oriented #analytics, manage #BigData in original form wo/transformation.
27. Reporting and #analytics are different practices; managing #BigData for each is, too.
28. #BigData needs data standards, but different ones compared to other enterprise data.
29. Streaming #BigData is easy to capture & manage offline, but tough to process in #RealTime.
30. Non-SQL, non-relational platforms are coming on strong; BI/DW needs them for diverse #BigData.
Want to learn more about managing big data?
For a much more detailed discussion—
in a traditional publication!—get the TDWI Best Practices Report, titled
Managing Big Data, available in a PDF file via a free download.
You can also register for and replay my
TDWI Webinar, where I present the findings of
Managing Big Data.
Please consider taking courses at the
TDWI World Conference in Boston, October 20–25, 2013. Enroll online.
============================
Philip Russom is the research director for data management at TDWI. You can reach him at
[email protected] or follow him as @prussom on Twitter.
Posted by Philip Russom, Ph.D. on October 11, 20130 comments
Treat them differently, if you want to get the most out of each.
By Philip Russom, TDWI Research Director for Data Management
I regularly get somewhat off-base questions from users who are in the thick of implementing or growing their analytic programs, and therefore get a bit carried away. Here’s a question I’ve heard a lot recently: “Our analytic applications generate so many insights that I should decommission my enterprise reporting platform, right?” And here’s a related question: “Should we implement Hadoop to replace our data warehouse and/or reporting platform?”
The common misconception I perceive behind these questions (which makes them “off-base” in my perception) is that people seem to be forgetting that analytics and reporting are two different practices. Analytics and reporting serve different user constituencies, produce different deliverables, prepare data differently, and support organizational goals differently. Despite a fair amount of overlap, I see analytics and reporting as complementary, which means you most likely need both and neither will replace the other. Furthermore, due to their differences, each has unique tool and data platform requirements that you need to satisfy, if you’re to get the most out of each.
Allow me to net it out with a few sweeping generalizations.
Reporting is mostly about entities and facts you know well, represented by highly polished data that you know well. And that data usually takes the form of carefully modeled and cleansed data with rich metadata and master data that’s managed in a data warehouse. In fact, it’s difficult to separate reporting and data warehouses, because most users designed their DWs first and foremost as a repository for reporting and similar practices such as OLAP, performance management, dashboards, and operational BI.
I regularly hear claims that Hadoop can replace a true DW. But I doubt this, because the current state of Hadoop cannot satisfy the data requirements of enterprise reporting near as well as the average DW can. Ultimately, it’s not about the warehouse per se; it’s about practices a DW supports well, such as reporting. I reserve the right to change my mind in the future, because Hadoop gets more sophisticated almost daily. My real point: most enterprise reporting depends on a DW for success, so keep and protect the DW.
Advanced analytics enables the discovery of new facts you didn’t know, based on the exploration and analysis of data that’s probably new to you. New data sources generally tell you new things, which is one reason organizations are analyzing big data more than ever before. Unlike the pristine data that reports operate on, advanced analytics works best with detailed source data in its original (even messy) form, using discovery oriented technologies, such as mining, statistics, predictive algorithms, and natural language processing. Sure, DWs can be expanded to support some forms of big data and advanced analytics. But the extreme volumes and diversity of big data are driving more and more users to locate big data on a platform besides a DW, such as Hadoop, DW appliances, or columnar databases.
I personally think that providing separate data platforms for reporting and analytics is a win-win data strategy. It frees up capacity on the DW, so it can continue growing and supporting enterprise reporting plus related practices. And it gives advanced analytics a data platform that’s more conducive to exploration and discovery than the average DW is.
Reporting is like a “high-volume business,” whereas analytics is like a “high-value business.” For example, with so-called enterprise business intelligence, thousands of concurrent report consumers access tens of thousands of reports that are refreshed nightly. By comparison, a small team of data analysts can transform an organization with a few high-value insights, such as new customer segments, visibility into costs, correlations between supplies and product quality, fraud detection, risk calculations, and so on. For completely different reasons, you need both reporting and analytics to serve the full range of user constituencies and provide many different levels of information and insight.
Most reports demand numeric precision, whereas most analyses don’t. Think financial reports (accurate to the penny) versus website page view reports (where guesstimates are fine).
Most enterprise reports require an audit trail, whereas few analyses do. Think regulatory reports versus the scores of an analytic model for customer churn.
Data management techniques differ. Squeaky clean report data demands elaborate data processing (for ETL, quality, metadata, master data, and so on), whereas preparing raw source data for analytics is simpler, though at higher levels of scale.
CONCLUSIONS: Despite some overlap, enterprise reporting and advanced analytics are so different as to be complementary. Hence, neither will replace the other. Both do important things for an information-driven organization, so you must give each what it needs for success, both at the tool level and at the data management level. Taking seriously the data requirements of big data analytics may lead you to implement Hadoop; but that doesn’t mean that Hadoop will replace a DW, which is still required to satisfy the data requirements of reporting and related practices, such as OLAP, performance management, dashboards, and operational BI.
Posted by Philip Russom, Ph.D. on September 26, 20130 comments
We just concluded the
TDWI Big Data Analytics Solution Summit in Austin, Texas (September 15–17). It was a great success; many thanks go to our speakers, sponsors, TDWI colleagues who managed the event, and to everyone who attended. A special thanks to Krish Krishnan, who co-chaired the conference. We are already planning the 2014 Big Data Analytics Solution Summits to be held in the spring and fall, so keep an eye out for details on these events if you are interested in attending.
In Austin, I had the chance to talk with a broad range of attendees. Some were in the early stages of planning and technology acquisition for big data analytics, while others were in the middle of ongoing, funded projects involving enterprise data warehouses, analytic platforms, Hadoop, Hive, MapReduce, and related technologies. We had data scientists and BI and data warehouse architects in attendance as well as business and IT leadership.
I heard exciting tales of initiatives driven by C-level executives who were pushing hard to gain competitive advantages by infusing new business ventures with richer data insights about customer behavior, product and service affinity, and process optimization. It was clear that in the often confusing world of big data, where organizations are on a voyage of discovery, it is a major plus to have high-level leadership that can define objectives and desired outcomes.
Briefly, here are three takeaways from the Summit:
- Finding professionals with big data skills remains a huge challenge. In my introductory remarks at the Summit, I reported on results of our latest TDWI Technology Survey, which asked attendees at the August 2013 World Conference in San Diego to rank their big data challenges. The survey found that dealing with data variety and complexity is the biggest challenge right now, followed by data volume and data distribution. However, when I wrote the survey, I neglected to include finding skilled professionals among the challenges that attendees could rank. In conversations with Summit attendees, this was most often cited as their biggest challenge.
- Big data analytics is about speed. In both presentations and sponsor panel discussions, “speed” was cited numerous times as the chief benefit sought from big data analytic discovery. Organizations want faster speed to insight than they are getting from traditional BI and data warehousing systems; they know that if they can apply insights about customer behavior, marketing campaign performance, projected margins, and other concerns faster, they will save their organizations money and create business advantages. David Mariani, CEO of @Scale, Inc., and former VP of engineering at the social analytics data services provider Klout, gave a great presentation that brought into focus why Hadoop has been so valuable. Mariani discussed why emerging interactive query engines like Cloudera’s Impala and Apache Shark will change the game by adding significant speed-to-insight capabilities to the Hadoop environment.
- Integrating data views is essential to realizing big data value. Some of the most compelling case studies at the conference were about how organizations can build profitable ventures based on a foundation of integrated data analysis. Dr. Tao Wu, lead data scientist at Nokia’s Data and Analytics organization, offered a powerful case study presentation about Nokia’s HERE business. With a centralized analytics platform rather than disconnected silos, Nokia has been able to improve products by analyzing the combination of mobile and location data.
Posted by David Stodder on September 24, 20130 comments
As I mentioned in my last blog post, I am in the process of gathering survey data for the TDWI Best Practices Report about predictive analytics. Right now, I'm in the data analysis phase. It turns out (not surprisingly) that one of the biggest barriers to adoption of predictive analytics is understanding how the technology works. Education is definitely needed as more advanced forms of analytics move out to less experienced users.
With regard to education, coincidentally I had the pleasure of speaking to Eric Siegel recently about his book, Predictive Analytics: The Power to Predict Who Will Click, Buy, Lie, or Die (www.thepredictionbook.com). Eric Siegel is well known in analytics circles. For those who haven’t read the book, it is a good read. It is business focused with some great examples of how predictive analytics is being used today.
Eric and I focused our discussion on one of the more technical chapters in the book that addresses the problem known as overfitting (aka overlearning)—an important concept in predictive analytics. Overfitting occurs when a model describes the noise or random error rather than the underlying relationship. In other words, it occurs when your data fits the model a little too well. As Eric put it, "Not understanding overfitting in predictive analytics is like driving a car without learning where the brake pedal is."
While all predictive modeling methods can overlearn, a decision tree is a good technique for intuitively seeing where overlearning can happen. The decision tree is one of the most popular types of predictive analytics techniques used today. This is because it is relatively easy to understand—even by the non-statistician—and ease of use is a top priority among end users and vendors alike.
Here's a simplified example of a decision tree. Let's say that you're a financial institution that is trying to understand the characteristics of customers who leave (i.e., defect or cancel). This means that your target variables are leave (yes) and don't leave (no). After (hopefully) visualizing or running some descriptive stats to get a sense of the data, and understanding the question being asked, the company puts together what's called a training set of data into a decision tree program. The training set is a subset of the overall data set in terms of number of observations. In this case it might consist of attributes like demographic and personal information about the customer, size of monthly deposits, how long the customer has been with the bank, how long the customer has used online banking, how often they contact the call center, and so on.
Here's what might come out:

The first node of the decision tree is total deposit/month. This decision tree is saying that if a customer deposits more than $4K per month and is using online bill pay for more than two years, they are not likely to leave (there would be probabilities associated with this). However, if they have used online banking for less than two years and contacted the call center X times, there may be a different outcome. This makes sense intuitively. A customer who has been with the bank a long time and is already doing a lot of online bill paying might not want to leave. Conversely, a customer who isn't doing a lot of deposits and who has made a lot of calls to the call center might be having trouble with the online bill pay. You can see that the tree could branch down and down, each branch with a different probability of an outcome, either yes or no.
Now, here's the point about overfitting. You can imagine that this decision tree could branch out bigger and bigger to a point where it could account for every case in the training data, including the noisy ones. For instance, a rule with a 97% probability might read, "If customer deposits more than $4K a month and has used online bill pay for more than two years, and lives in ZYX, and is greater than 6 feet tall, then they will leave." As Eric states in his book, "Overlearning is the pitfall of mistaking noise for information, assuming too much about what has been shown in the data." If you give the decision tree enough variables, there are going to be spurious predictions.
The way to detect the potential pitfall of overlearning is apply a set of test data to the model. The test data set is a "hold out"; sample. The idea is to see how well the rules perform with this new data. In the example above, there is a high probability that the spurious rule above won't pan out in the test set.
In practice, some software packages will do this work for you. They will automatically hold out the test sample before supplying you with the results. The tools will show you the results on the test data. However, not all do, so it is important to understand this principle. If you validate your model using hold-out data, then overfitting does not have to be a problem.
I want to mention one other point here about noisy data. With all the discussion in the media about big data, there has been a lot said about people being misled by noisy big data. As Eric notes, "If you checking 500K variables you'll have bad luck eventually—you'll find something spurious." However, chances are that this kind of misleading noise is from an individual correlation, not a model. There is a big difference. People tend to equate predictive analytics with big data analytics. The two are not synonymous.
Are there issues with any technique? Of course. That's why education is so important. However, there is a great deal to be gained from predictive analytics models, as more and more companies are discovering.
Posted by Fern Halper, Ph.D. on September 11, 20130 comments