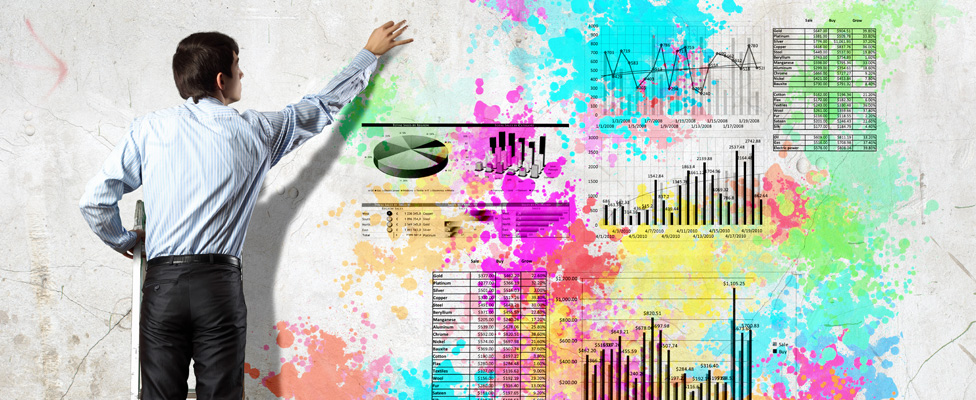
Data visualizations show the cost of eggs, the popularity of cereal, and when people wake up and eat.
- By Upside Staff
- February 8, 2023

Enterprises may be able to use conversational AI to create deeper connections with more customers.
- By Rob Enderle
- February 3, 2023

One type of data visualization to avoid and other charts about cars.
- By Upside Staff
- February 1, 2023

Some data visualizations look back over the pandemic while others keep us up to date on how the situation continues to change.
- By Upside Staff
- January 25, 2023

Pitfalls to avoid when getting started, the state of the industry, and advancing your data science career.
- By Upside Staff
- January 24, 2023

New and innovative applications for machine learning, big data, and graph analytics.
- By Upside Staff
- January 19, 2023

Turning dashboards into stories, popular chart types, and basic best practices.
- By Upside Staff
- January 18, 2023

These links show how data visualizations can reveal agendas, highlight code conflicts, and explain book ratings.
- By Upside Staff
- January 11, 2023