
 View online: tdwi.org/flashpoint


February 4, 2016
ANNOUNCEMENTS
NEW Best Practices Report
Operationalizing and Embedding Analytics for Action
NEW Checklist Report
Seven Best Practices for Adopting Data Warehouse Automation
NEW Checklist Report
Seven Steps to Faster Analytics Processing with Open Source: Realizing Business Value from the Hadoop Ecosystem
NEW Ten Mistakes to Avoid
When Deploying Visual BI and Analytics for Business Decisions
NEW TDWI E-Book
Data Warehouse Automation: Accelerating Business Results
NEW TDWI Infographic
Emerging Technologies for Business Intelligence, Analytics, and Data Warehousing
CONTENTS

2015 TDWI BI Benchmark Report: More Maturity and Value in BI Deployments

Start from the Question—A Guide to Unstructured Text Analysis

Data Interaction and Collaboration

Mistake: Neglecting to Build on Technology’s Popularity to Create an Analytics Culture

See what's
current in TDWI Education, Events, Webinars,
and Marketplace
2015 TDWI BI Benchmark Report: More Maturity and Value in BI Deployments
Mark Hammond
TDWI Contributing Analyst
Topic: BI Benchmark Metrics
More organizations are realizing more business value faster as business intelligence (BI) environments continue to mature. Additionally, many are doing it in enterprise-oriented and centralized models with nimble, multidisciplinary teams that use BI solutions to build a more data-driven business.
Those are among the findings of the 2015 TDWI BI Benchmark Report: Organizational and Performance Metrics for Business Intelligence Teams, designed to help BI professionals size up their performance against industry peers on such key metrics as return on investment (ROI), staffing, architecture, development methodologies, budgets, and reporting structures.
Now in its ninth year and available exclusively to TDWI Premium Members, the latest edition of the long-running study is based on a worldwide survey of 259 BI professionals, including IT personnel, business sponsors and users, and systems integrators. It aligns with findings of past years in quantifying BI’s ongoing maturation amid ever-changing challenges and trends.
For instance, the number of organizations realizing high business value from BI deployments reached 28 percent in 2015, the highest level recorded in the TDWI BI Benchmark Report series. Forty-two percent of organizations began realizing ROI from their latest BI iterations within a year, up notably from recent years.
For BI professionals, the challenge is to continue refining techniques and strategies and juggling initiatives that address emerging opportunities in such areas as real-time information, big data, mobile devices, and the Internet of Things. To explore what works and what doesn’t, our study slices survey data by a number of select dimensions:
Development methodologies. A hybrid of agile and waterfall methodologies is a good bet for delivering solid business value, generating low value for just 13 percent of organizations in 2015. A 29 percent rate of high business value with a hybrid approach in 2015 is second only to waterfall, at 38 percent.
Scope of BI environments. Enterprise BI environments deliver high business value (cited by 34 percent of respondents) more often than those that support a department or business unit. Not coincidentally, an enterprise focus is the most common approach, in place at 66 percent of organizations.
BI team staffing. The typical organization had an average of 4.2 BI teams in place in 2015, down from 10.7 in 2011 and the lowest number recorded in this survey series. The average number of full-time equivalent (FTE) employees per project dipped slightly to 4.9. However, the best results (cited by 38 percent of organizations) are realized by teams of seven or more FTEs per project.
BI maturity. Business value rises in lockstep with BI maturity and the number of years spent building an environment. Organizations that have built out BI implementations for 10 years or more see the greatest incidence of high value, at 53 percent in 2015.
The BI benchmark survey also reminds us, however, that BI is a fairly new endeavor for a sizable number of organizations. Forty-seven percent of BI environments have been in place for five or fewer years, and 17 percent are less than two years old. Those relative newcomers are well positioned to take advantage of established and evolving best practices to maximize returns from their BI investments.

Mark Hammond is a veteran contributor to TDWI publications, including a number of research reports, the Business Intelligence Journal, What Works, and more.


Start from the Question—A Guide to Unstructured Text Analysis
Seth Redmore
Text is one of the most important modes of human communication. To truly listen to your customers, partners, competitors, and employees, you must be able to understand the text they’re exchanging with you and among themselves.
The science of unstructured text analytics has been around for many years and is used for many different purposes, from social marketing to customer experience management to helping managers understand customer support trends. It’s used to help engineering ship new product features that match market needs.
This article discusses how to start from the question to understand what text you need to answer that question. It’s a primer on several specific technologies that are used for text analytics, and it explains different ways of implementing an unstructured text analytics system that will lead to the greatest probability of success.
Learn more: Read this article by downloading the Business Intelligence Journal (Vol. 20, No. 4).

Highlight of key findings from TDWI's wide variety of research
Data Interaction and Collaboration
David Stodder
Business users are drawn to visual analytics and data discovery tools and applications because these tools offer broader opportunities to interact with data and perform and present analytics results to colleagues in ways that might have previously required advanced programming knowledge. Business users responsible for identifying competitive advantages, creating strategies for improving operational efficiency, detecting fraud, and spotting untapped market segments need easier and more advanced ways to analyze data. Software tools can provide nontechnical users with a means of engaging in predictive, prescriptive, descriptive, or diagnostic analyses through easy-to-use, graphical interfaces. Working with visual items rather than code, users can drag and drop items, measures, or variables they want to apply.
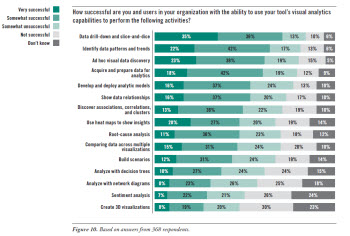
Our study examined the success with which research participants and users in their organizations use visual analytics to perform a range of activities via their chosen tools (see Figure 10). Research participants indicated the greatest success with traditional BI/OLAP drilling down and data slicing and dicing (71% successful, with 35% very successful). A strong percentage also noted success in identifying data patterns and trends (64%, with 22% very successful) and ad hoc visual data discovery (61% successful, with 23% very successful)—both of which are defining activities in self-service data exploration.
A little over half (53%) of participants said they and users in their organizations have success in showing data relationships (16% very successful); 47% noted success in using heat maps to show insights (20% very successful). These results indicate moderate success in employing data visualization functionality to improve analysis and potentially improve collaboration on data. There appears to be less success—and perhaps less experience—with creating 3D visualizations (27% successful, with just 8% very successful).
(Click for larger image)
Read the full report: Download the TDWI Best Practices Report Visual Analytics for Making Smarter Decisions Faster (Q3 2015).


FlashPoint Rx prescribes a "Mistake to Avoid" for business intelligence and data warehousing professionals.
Mistake: Neglecting to Build on Technology’s Popularity to Create an Analytics Culture
David Stodder
As more users adopt visual BI and analytics technologies and interact more with data, organizations need to think about the cultural and organizational factors important to creating a truly data-driven and analytics-driven organization. They need to overcome resistance and build trust in the process of creating insights from data and applying them to decisions and actions. If they do not, successes in analytics will remain isolated and will never lift the entire organization’s data-driven intelligence.
Organizations have begun to create an “analytics culture”—that is, a culture that nurtures good practices in using data and analytics to support decisions throughout the organization. Such a culture supports challenging assumptions, learning from the data, and owning outcomes by measuring the impact of decisions based on analytics. It cannot be created overnight. Organizations need to work on developing an analytics culture that matures in a healthy direction. (Note: For guidance on maturity self-assessment, consult the TDWI Analytics Maturity Model and Assessment Tool.)
The democratization of analytics fostered by the spread of self-service technologies means that advanced practices such as predictive analytics and data mining may no longer be the sole province of highly educated data scientists, statisticians, and data analysts. Some nontechnical business users will be interested in trying these practices themselves, or in working more collaboratively with specialized data scientists, statisticians, and data analysts on projects and then using visualization tools to share findings with colleagues.
Organizations should encourage teamwork as a key component of a thriving analytics culture. They should ensure that business users and IT professionals are communicating so resources are available and differences over project control are addressed early.
A strong analytics culture can help those who resist relying on analytics in their decision processes to gain confidence in the technology. Training in data storytelling, demonstration skills, and creating simulations is important to furthering an analytics culture. IT can contribute by creating data “sandboxes,” either on premises or in the cloud, where personnel can try out analytics processes without causing problems with data warehouses and systems of record.
Read the full issue: Download Ten Mistakes to Avoid When Deploying Visual BI and Analytics for Business Decisions (Q4 2015).

