
 View online: tdwi.org/flashpoint


December 10, 2015
ANNOUNCEMENTS
NEW Checklist Report
Modernizing Data Integration to Accommodate New Big Data and New Business Requirements
NEW TDWI E-Book
Data Warehouse Automation: Accelerating Business Results
NEW TDWI E-Book
Predictive Analytics: From the Back Room to the Boardroom
NEW Best Practices Report
Emerging Technologies For Business Intelligence, Analytics, and Data Warehousing
NEW TDWI Assessment Tool
Hadoop Readiness Assessment
CONTENTS

Viewing Business Intelligence through a Capability Lens

Fire Up Your Social Media Strategy with Big Data Analytics

Visual Interaction with Diverse Data Sources

Mistake: Failure to Secure Executive Buy-in Early in Your Project

See what's
current in TDWI Education, Events, Webinars,
and Marketplace
Viewing Business Intelligence through a Capability Lens
Mark Peco
CBIP, Consultant, Educator, and TDWI Faculty Member
The modern economy continues to increase its dependencies on data and information for generating wealth, creating opportunities, and regulating activities. Companies, governments, and other organizations are working to become more “data driven” to help them deliver stakeholder value and monitor operational feedback to support ongoing decision making.
Although the term business intelligence (BI) has been used for over 20 years to describe various aspects of managing a data-driven organization, classic definitions were originally based on technology. The component view of BI described the technical and data assets that were needed to deliver the required information, while the functional view described the processing, operations, and applications software needed to acquire raw data and transform it into useful information.
However, both of these views are incomplete in terms of understanding how a technology platform actually generates value for an organization. New advances in data storage technology, source data availability, analytic algorithms, visualization techniques, and open source software create challenges in fitting everything together. How do new concepts and terms such as big data, open data, predictive analytics, advanced visualization, data lakes, enterprise data hubs, and machine learning relate to current activities?
A new model is needed to help organizations understand how to harness these opportunities to enhance their market position and business results. Rather than the classic component and functional definitions of BI, a capability-based definition may prove more effective. This approach explains how business value generation is linked with technology and data, and how organizational leadership provides a solid foundation.
Understanding Capabilities
A capability is defined as an organization’s ability to produce desired outcomes. At the organizational level, capabilities are initially defined independently of structure, process, data, or technology. Capabilities answer what needs to be done to accomplish the goals of the organization.
Capabilities are defined at multiple levels. At a high level, capabilities are identified by understanding what the organization needs to do to accomplish its strategic objectives and are represented in a capability map. The map identifies dependencies between capability categories and exposes lower levels of detail that help organizations understand the requirements of each capability. This, in turn, leads to design and implementation.
To be clear, capabilities are not the same thing as competencies. Capabilities define what needs to be done; competencies describe how well the organization can do it. Capabilities form the building blocks of a strategy; competencies measure how well each capability will perform.
The Capability Map: Your Guide to BI Success
From a capabilities perspective, BI aims to deliver business capabilities rather than a set of components or functions. Integral to this process is the creation of the capability map. The map provides a holistic perspective of the BI system and what components and processes are needed. This helps us understand how to combine technologies, people, data, skills, and other assets into a cohesive business-value-generating system based on enabling business capabilities. The appropriate set of business capabilities enables meaningful and impactful business outcomes. At the organizational level, impact can be defined as the attainment of strategic objectives. This is the value that organizations are seeking from their investments in BI.
A capability map for BI that drives targeted areas of impact contains the following four levels:
- Business capabilities
- Analytics capabilities
- Data capabilities
- Leadership capabilities
The Capability Hierarchy
At the top level, business capabilities are the primary outcome of the BI system that drives meaningful impact. Business capabilities are enabled by analytics capabilities, which are enabled by data capabilities. All of these capabilities rely on a strong foundation of leadership capabilities. Context and requirements flow from upper to lower levels—business capabilities define the requirements for analytics capabilities, which define the requirements for data capabilities, and all three levels define the requirements for leadership capabilities.
Business capabilities define what abilities are needed for the organization to develop and regulate assets, plan, allocate resources, and execute work. They can be applied to a range of functional areas such as product development, marketing, sales, customer service, risk management, talent development, operations, quality, and finance.
Some examples of business capabilities that enable desired impact include:
- Monitor product quality
- Predict customer satisfaction
- Analyze resource requirements
- Diagnose machine performance
- Optimize capital requirements
As business capabilities are developed, a range of required analytics capabilities can then be defined. Analytics capabilities typically fall into one of the following categories:
- Discovery
- Descriptive
- Diagnostic
- Predictive
- Prescriptive
Discovery capabilities search for patterns and relationships in data. The resulting models that are created provide input to a required business capability.
Descriptive capabilities identify the normal behavior of business processes, asset performance, customer behavior, and so on. This normal behavior is captured in order to establish parameters for detecting abnormal conditions such as fraud or quality defects.
Diagnostic capabilities are used to identify when conditions in a process are no longer “normal” or acceptable. Root cause analysis is carried out using models, data, and known business rules to recommend corrective actions.
Predictive capabilities deploy models within software and are used by people in decision-making roles. The capability to make predictions and to respond to them requires governance and leadership capabilities for support.
Prescriptive capabilities allow analysts and managers to explore options and alternative scenarios using simulation techniqes to answer questions such as “What should I do next?” and “Which scenario should I follow?”
All of these analytics capabilities rely on clean and current data for their operation. This defines the data capabilities the organization must possess, including:
- Acquisition capabilities enable the search, discovery, and sourcing of required data to enable the upper capability levels
- Protection capabilities enable all aspects of security, privacy, and access rights to data
- Provisioning capabilities ensure the effective selection and use of technologies to store and provide data to the upper capability levels
- Integration capabilities ensure that data from various formats and structures is placed into a meaningful and useful state to support the required analytics capabilities
Leadership capabilities are the essential bedrock that supports the entire capability model. Important leadership capabilities include:
- Data governance capabilities
- Collaboration capabilities
- Value generation capabilities
- Program delivery capabilities
- Data-driven culture development capabilities
- Competency development capabilities
Many BI outcomes disappoint because organizations may suffer from weak leadership capabilities. It is leadership capabilities that ensure that organizational friction is reduced, virtual teams work together, trust and relationships across groups are strong, and the necessary competencies and skills are in place. Strong leadership capabilities are also key to maintaining accountability for specific data, technology, and business results.
Summary: Organizing for Success
Harnessing the full potential of BI capabilities requires that companies take a broad organizational perspective instead of narrower departmental views. The capabilities model relies on taking a holistic view when designing the critical pieces of the BI ecosystem, as well as requiring that the value proposition of all BI-related investments be understood and aligned across the organization.
The model requires that all critical pieces of the puzzle (people, data, models, software, technology, and governance) be identified, developed, and combined into a cohesive BI system that delivers the organizational capabilities needed to drive desired outcomes. The capability-based approach minimizes narrow thinking that inhibits the value that BI can ultimately generate.
The capabilities approach provides a foundation for evaluating when and if new data sources or new technologies will be brought into the organization. If a new idea or opportunity—whether originating from open source software, big data availability, or machine learning—cannot be aligned with a desired business capability that will be enabled, it does not become part of the BI ecosystem.
Mark Peco, CBIP, is a consultant and educator holding undergraduate and graduate degrees in engineering from the University of Waterloo. He is an independent consultant based in the Toronto area and is also a faculty member of TDWI.


Fire Up Your Social Media Strategy with Big Data Analytics
Troy Hiltbrand
In the age of digital business, the Internet has become a platform for connecting businesses with customers on a much more personal level. Social media act as public forums where customers who are looking for answers can be united with businesses providing solutions. To take advantage of this new form of communication, businesses must develop a social media strategy. With the deluge of information available on social media, analytics is key to enabling businesses to home in on the right users at the right moment for the right engagement.
Learn more: Read this article by downloading the Business Intelligence Journal, Vol. 20, No. 3.

Highlight of key findings from TDWI's wide variety of research
Visual Interaction with Diverse Data Sources
As self-service visual analytics and data discovery expands across an organization, a greater variety of users will need to access a greater variety of data. Sources that are important for customer intelligence and tracking operational efficiency are often less structured than transactional or business data needed for cost management or other more traditional BI demands. Thus, organizations need to develop a strategy for enabling users to access and analyze a broader selection of data.
TDWI asked research participants how successful users in their organizations are in using their chosen tool’s visual interaction capabilities to access and analyze a variety of important data sources (see Figure 6). Not surprisingly, participants said they and users in their organizations are most successful accessing and analyzing spreadsheet data (81% successful, with 44% very successful). Spreadsheets are often the first and most-available data source for users when they implement visual analytics and data discovery tools; many are seeking precisely better visualization and data interaction with spreadsheet data so they can perform more types of analysis with less custom coding.
(Click for larger image)
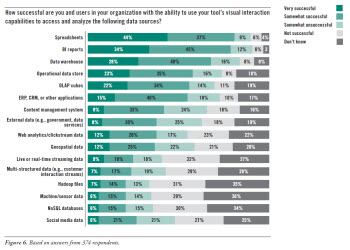
Research participants indicated that users are almost as successful in accessing and analyzing data in BI reports (79% successful, with 34% very successful). They also indicated that users have fairly good success with data held in the data warehouse (68% successful, with 28% very successful). Moving beyond these traditional sources, our research finds that users are having less success—keeping in mind that not all of these sources are important to all research participants’ users (hence the higher “don’t know” percentages for some of the less traditional sources). For example, 37% said their users are successful (with just 12% very successful) accessing and analyzing geospatial data, which is rising in importance as a data source for marketing, sales, customer service, and strategic planning.
Newer sources appear to be harder for users in research participants’ organizations to access and analyze. Just 21% said they are seeing success in analyzing data in Hadoop files (7% very successful). Slightly more (24%) are successful in accessing and analyzing multi-structured data such as customer interaction streams (7% very successful).
Read the full report: Download the TDWI Best Practices Report Visual Analytics for Making Smarter Decisions Faster.


FlashPoint Rx prescribes a "Mistake to Avoid" for business intelligence and data warehousing professionals.
Mistake: Failure to Secure Executive Buy-in Early in Your Project
Fern Halper
Often, the technology is the easiest part of deploying predictive analytics. Typically, organizational issues are the biggest stumbling block of a predictive analytics project. One mistake organizations make is not considering organizational and cultural buy-in issues when deploying predictive analytics. These can come from all levels of your organization.
One big organizational issue is getting initial buy-in from executives. Executive buy-in paves the way for funding of predictive analytics projects. Executives can also help you sell predictive analytics to the rest of your organization. They often set the tone. If you’re lucky, you have executive support. However, getting executive buy-in can take time. Sometimes, more advanced analytics enters an organization when there is some sort of management change. A new executive may be more data-driven and support predictive analytics efforts. She/he will appoint a team to get the effort started.
If they don’t have executive support from the start, members of an organization will often go door to door to find a key executive stakeholder. This can require numerous meetings with potential sponsors until the right one(s) is found. The people involved in this kind of organic growth need to be able to communicate the project’s value to the executives, and this might involve a proof of concept (POC) or a proof of value to illustrate the promise of the technology.
There are a few points to keep in mind when building a POC. The first is that it addresses a real need yet is doable. Doable means the people and technology exist to make it happen. It also means that the data is available for the POC. You may have a good idea about building a POC that predicts when a certain machine will require maintenance, but if you can’t access the data, the POC won’t get far. A key is to choose a POC where you are fairly certain you can show value.
Read the full issue: Download Ten Mistakes to Avoid In Predictive Analytics Efforts (Q3 2015).

