 View online: tdwi.org/flashpoint


March 5, 2015
ANNOUNCEMENTS
NEW Best of TDWI Volume 12
Top Stories and What's Ahead in 2015
CONTENTS

The Road to Analytics Maturity Is Often Paved with Potholes
Value-Driven Analytics: The Emerging Fourth Generation of Analytics

A Marriage of Necessities: Why Integrating Spatial Analysis with Major BI Platforms is Essential

Real-Time: Problem or Opportunity?

Mistake: Failing to Take Advantage of Data Visualization

See what's
current in TDWI Education, Events, Webinars,
and Marketplace
The Road to Analytics Maturity Is Often Paved with Potholes
Fern Halper
TDWI Research Director for Advanced Analytics
What does it take to become mature in analytics? Analytics maturity can be described as the evolution of an organization to integrate, manage, and leverage all relevant internal and external data sources into key decision points. It means creating an ecosystem that enables insight and action. It’s not simply about putting software in place; it involves technologies, data management, analytics, governance, and organizational components. It can take time to create and instill an analytics culture.
Last fall, TDWI released its Analytics Maturity Model and Assessment Tool. The model describes the stages that organizations move through as they gain analytics maturity and know-how. Some key characteristics of each stage include:
- Nascent: The company is not utilizing analytics, except perhaps for a spreadsheet program. Support is lacking, but pockets of people may be interested in the value of analytics. The culture is not data driven and decisions are made based on gut instinct rather than fact.
- Pre-adoption: The organization is starting to do its homework about analytics. One or more departments may have invested in analytics technology such as single instances of a low-cost, front-end BI or data discovery tool or a back-end database, data mart, or data warehouse for managed reporting. People are starting to understand the power of analysis for improving decisions and business outcomes.
- Early adoption: The business is putting analytics tools and methodologies in place and thinking about data management and reporting or dashboards. Users often spend a long time moving through this stage and often must cross through a chasm, which involves a series of challenges such as obtaining the right skill set and getting past the politics of resistance to deploy and take action on analytics.
- Corporate adoption: Analytics can transform how organizations do business. More end users may get involved. Analytics can become operationalized as part of a business process to take action. Companies will be using disparate kinds of data, even big data that is semi-structured or unstructured, in a considered way for their analytics efforts.
- Visionary: Very few companies are visionary in their analytics efforts. Here, analytics is not simply used to drive insight and action; instead, the business is always looking for opportunities to use analytics in new ways. The infrastructure is highly tuned and governance is in place. There is excitement and energy around analytics and a healthy and agile analytics culture.
The TDWI Analytics Maturity Model Guide highlights these stages in more detail. The model also comes with an online assessment that measures how an organization stacks up against peers across five dimensions: organization, infrastructure, data management, analytics, and governance. Users who take the assessment will receive their overall score, as well as their score across these five dimensions and how it compares to companies in the same industry and of the same size.* The accompanying guide helps explain the results.
Where Are We Now?
Have organizations reached analytics maturity? No. In the assessment results to date, respondents on average fall into the pre-adoption to early adoption stages. That’s where the potholes come in. Often organizations think they are making progress only to get a flat tire when they hit a pothole. Among those potholes: trying to obtain analytic talent, implement a funded road map, or deal with cultural issues. They are typically working with structured data only, and governance is lacking. Although these organizations have some idea of the questions they need answered with analytics, business- IT alignment, intolerance for early failures, and business access to data are still issues. This is especially true when there is no executive support or understanding of the analytics effort.
In terms of democratizing analytics, according to the results of the assessment to date, only about 20 percent of an organization’s business analysts, data analysts, and business users have the tools and know-how to analyze data in a self-service environment without close IT involvement.
Taking the Next Steps
Companies that are making progress toward being data driven and action oriented typically share these characteristics:
- They believe in training. Assessment results indicate there is a correlation between training users to perform more advanced analytics and organizations taking action. Training cannot be overlooked. As you move forward in analytics maturity, shifts occur. One of these shifts is using more advanced analytics. Regardless of the movement to make tools easier to use, analytics skills are still needed. The analyst must interpret and understand the results, whether the tool is a self-service visualization tool or something more advanced, such as predictive analytics. Likewise, skills are needed on the infrastructure side to operationalize analytics and drive them into business applications.
- They deliver incremental rollouts. Those who take action look to provide incremental value rather than waiting until the end of the development life cycle to provide a finished product. This supports an agile approach. It also supports understanding what business problems you’re trying to solve. It makes sense to put a road map together with incremental rollouts where you can measure specific outcomes that relate to these business challenges.
- They lay a road map, even if it might change. The “everyone grab a hammer, let’s build a house” mentality doesn’t work for analytics. More mature organizations that are taking action often have executives who understand what they are trying to do. Part of that includes building a road map, even if it might change. The road map doesn’t have to be fancy, but it is important to know where you are going. It also helps secure funding. Often it starts with a proof of concept, which can be useful as a small win to illustrate value.
The good news is that the majority of organizations that took the Analytics Maturity Assessment to date realize the benefits of analytics, as do many of their executives. Often the next step, regardless of your stage of maturity, is to be purposeful in your intent and stay the course. There is no silver bullet, but organizations can be successful in their analytics efforts and derive top- and bottom-line impact.
*To date, 251 people have taken the assessment.
Fern Halper Ph.D., is director of TDWI Research for advanced analytics. She is well known in the analytics community, having published hundreds of articles, research reports, speeches, Webinars, and more on data mining and information technology over the past 20 years. You can reach her on Twitter @fhalper and on LinkedIn at linkedin.com/in/fbhalper.

Value-Driven Analytics: The Emerging Fourth Generation of Analytics
Tony Rathburn
The Modeling Agency
The use of quantitative techniques to assist business decision makers is not a new approach. The evolution of analytics can currently be broken into four distinct generations:
First Generation: Deterministic Analysis
Business decision makers have always kept records and used their historical experience to assist in making decisions about the future.
These were almost universally manual efforts and were time-consuming, tedious, and error-prone. Only by the mid-20th century did a few organizations begin to have access to computers to assist in these analytics efforts.
The techniques employed were equally basic and were often limited to the use of ratios and basic statistical calculations.
Second Generation: What-if Analysis
With the development of personal computers, the introduction of spreadsheet technology changed the future of both business and analytics.
In the 1980s we witnessed the almost universal elimination of first-generation analytics. Decision makers now could collect relatively large sets of data, perform complex calculations, and consider a variety of alternative assumptions in an effort to enhance performance and achieve their business objectives more effectively.
The inclusion of graphing capabilities, data handling, and built-in mathematical functions enhanced the basic what-if functionality of the spreadsheet. It is estimated that approximately 80 percent of all analytics is still being done using spreadsheet technology.
Third Generation: Machine Learning
The development of analytics is driven by decision makers’ desire to create a better estimate of a future event. Based on historical data and a set of current conditions, they want to know the value of a specific outcome.
Developing in parallel with spreadsheets, and often on personal computers as well, we saw decision makers with advanced quantitative skills develop increasingly sophisticated capabilities.
This increased sophistication also drove development of larger data repositories and assembling of advanced technology teams in many larger organizations.
The quantitative sophistication quickly moved beyond statistics and has taken on many forms. Technologies ranging from expert systems, neural networks, genetic algorithms, and a variety of machine learning methods have driven organizations to collect massive amounts of data.
Much of the technology sector is focused on supporting third-generation analytics in everything from data warehousing to supporting software and services in business intelligence, data mining, predictive analytics, and big data.
Fourth Generation: Value-Driven Analysis
The fourth generation of analytics is now emerging. It is driven by business decision makers who are increasingly demanding a return on investment from the projects they sponsor.
They need analytics projects that can be developed in less time and with smaller budgets to remain competitive in a rapidly changing environment.
They are also aware that the scope of the applicability of analytics spans many aspects of their organizations and far outstrips the time and resources of available development teams.
Organizations evolving into the fourth generation retain the business focus of the second generation while selectively utilizing the advanced techniques of the third generation. These organizations have similar characteristics in their utilization of analytics:
- Business-value-driven evaluation of potential projects
- Return-on-investment monitoring of completed projects
- Ad hoc project team development efforts
- Decentralized design with centralized development support
- Incremental development efforts
- Adopted organizational development methodology
- Priority given to rapid development efforts
Tony Rathburn is a senior consultant at The Modeling Agency, LLC. He is a frequent presenter at the TDWI Conferences.


A Marriage of Necessities: Why Integrating Spatial Analysis with Major BI Platforms is Essential
Clarence Hempfield
Although some 80 percent of business data contains actionable location information that could improve business processes/performance and create competitive advantage, few business intelligence (BI) platforms offer advanced geospatial functionality. Analysts interacting with their organizations’ chosen BI systems routinely cannot leverage location intelligence.
Organizations are understandably reluctant to chuck out their existing BI systems, even for the latest and greatest forklift upgrade. As competitive pressures and emerging opportunities keep analysts constantly seeking new ways to increase revenues from existing customers while also spotting new market segments, many companies have attempted to fill the gap by adopting multiplatform BI software environments.
This conflict has driven visionary users and developers to demand the rapid integration of highly usable geospatial analysis capabilities into their existing BI solutions. This article explores the need for such integration as well as the challenges that must be overcome.
Learn more: Read this article by downloading the Business Intelligence Journal, Vol. 19, No. 4

Highlight of key findings from TDWI's wide variety of research
Real-Time: Problem or Opportunity?
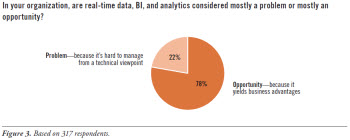
Establishing and sustaining real-time operations takes time, specialized skills, coordination with the business, and the right software functionality. With these requirements in mind, this report’s survey asked: “In your organization, are real-time data, BI, and analytics considered mostly a problem or mostly an opportunity?” (See Figure 3.)
Over three-quarters (78%) of organizations surveyed consider real-time operations an opportunity. Conventional wisdom today says that real-time data, BI, and analytics enable an otherwise unobtainable speed for fact-based decision making and analysis based on fresh data.
Less than a quarter (22%) consider real time a problem. Real-time data, BI, and analytics pose a number of technical and organizational challenges, as noted in the next section of this report. Relatively few organizations find that the challenges outweigh the benefits.
(Click for larger image)
Read the full report: Download Real-Time Data, BI, and Analytics (Q4 2014)

FlashPoint Rx prescribes a "Mistake to Avoid" for business intelligence and data warehousing professionals.
Mistake: Failing to Take Advantage of Data Visualization
David Stodder
Graphical interaction with data is fast becoming the expected norm for users, from executives to frontline personnel. Visualization should be a key concern when democratizing BI and analytics. Good data visualization can be a huge contributor to making smarter decisions and improving productivity with data. Poor visualization, on the other hand, can mislead users and make it more difficult for them to overcome the data onslaught. Unfortunately, many organizations think of data visualization as mere “eye candy” and do not devote enough attention to it.
Many tools now offer diverse libraries of visualizations beyond the standard bar and line charts. Users can choose from scatterplots, heat maps, tree maps, geographic maps, variance charts, and more. They can also put data in motion, which can be an effective technique for “storytelling” with data and getting viewers’ attention. The latest versions of tools are improving how they work with underlying data integration systems to keep the complexity of data access hidden from users.
More advanced tools let users move easily from one visual object to another, offering an immersive experience for discovering data relationships, filtering views, and making correlations and comparisons without dropping out of the visualizations to write queries. Users can pick up visual objects and embed them in other applications, such as sales-force and contact-center management.
It should be a top priority in democratization to improve data visualization and visual analysis, especially for users who have been limited to spreadsheets and simple reporting. Organizations should be careful to match visualization capabilities to the users’ roles and activities. Users can also benefit from training to help them avoid clutter and improve clarity, including how to personalize the appearance of visual objects in dashboards and other portals.
Read the full issue: Download Ten Mistakes to Avoid When Democratizing BI and Analytics (Q4 2014)

