 View online: tdwi.org/flashpoint


August 2, 2012
ANNOUNCEMENTS
NEW TDWI Best Practices Report:
Customer Analytics in the Age of Social Media
NEW TDWI Checklist Report:
Predictive Analytics Project Design: A Nine-Step Guide to Realizing Business Value
NEW TDWI E-Book:
Predictive Analytics
CONTENTS

The New Age of Business Intelligence

Context-Enabled Business Intelligence

The State of Next Generation Master Data Management

Mistake: Assuming Technical Maturity

See what's
current in TDWI Education, Events, Webinars,
and Marketplace

How BI/DW Solutions Add Value
Todd Saunders
Xtivia, Inc.
Topic:
Business Intelligence
We’ve been hearing for a long time now that the Field of Dreams approach--build it and they will come--simply does not work for a data warehouse (DW). I haven’t seen anything in the last several years to disprove this; in fact, the pendulum seems to have swung pretty far in the other direction. Companies are now much more insistent on a solid return on investment (ROI) for business intelligence (BI) initiatives.
If you have attempted to put together an ROI for a BI solution, you’ve likely run into difficulty attempting to quantify all the benefits. The costs are fairly straightforward, but so many of the benefits of a BI solution are intangible that it is impossible to fully quantify everything.
The most tangible (and easiest to quantify) benefit is the reduction in time needed to produce reports. Just about everyone has seen cases in which a quarterly report that used to take several weeks of effort to produce before the data warehouse now takes four hours after implementing a data warehouse. You can put real dollars on that. However, sticklers for detail may ask what happened to the resources that were previously spending their time producing said report. Were they laid off? If not, has the company actually saved real dollars?
Can you truly get more money in your company’s pocket by implementing BI? I say the answer is yes. However, the gain may not be due to BI alone. By its very nature, BI is not an isolated solution. It necessarily involves the three main aspects of any company: people, processes, and technology (including data). Because of this deep and inherent interdependency, it’s the impact of BI on these facets of an organization that increases real dollars.
Envision a buyer who is responsible for a company’s inventory levels. Before a BI/DW solution was implemented, the buyer received summarized order information days after orders were placed. This made it difficult for the buyer to keep the right amount of inventory on hand. Either the buyer places orders and spends money to stock up on parts that aren’t needed (thus reducing cash and increasing carrying costs) or the buyer does not order enough, possibly causing the company’s customers to cancel orders because products are out of stock, which translates to fewer revenue dollars.
In this example, a BI solution that gets order information to the buyer faster allows the buyer to spend money at the right time and better keep stock levels in line with demand. That means real dollars are staying in the company when they should, and revenue is flowing into the company at an optimal rate. The BI solution itself was not saving money or increasing revenue, but the BI solution’s effect on the buying process had a profound impact on the dollars associated with that process.
What if the inventory consisted of perishable items instead of parts? If items have an expiration date, it is even more vital to manage inventory levels appropriately. Picture a health-care provider that needs to keep drugs and medication on hand. Throwing away expired medications is the same as throwing away money.
Despite such examples, some clients still want to see an ROI calculation tied directly to a BI initiative. My experience is that we will spend many iterations hashing out the direct costs and benefits, and a lot of time discussing the resources needed to produce current reports both before and after a data warehouse is built. Will the analysts no longer needed be laid off or will they be assigned to other tasks (and be more effective at their jobs)? Is there a true dollar savings if they are not let go? During those iterations and discussions, it becomes clearer that the BI solution will have an impact on many different processes, and that the savings or increased revenue will come from the improvements in those processes.
Todd Saunders leads the business intelligence consulting practice at Xtivia, Inc., as EVP of customer solutions. He began working in the BI field in 1995 and has been building BI organizations and delivering BI solutions ever since.

The New Age of Business Intelligence
Krish Krishnan
Sixth Sense Advisors, Inc.
Topic:
Business Analytics
In the past decade, we have seen an unprecedented explosion in availability of data that can be used for improving business intelligence and customer centricity. This data comes from nontraditional sources, such as social media, third-party sources, videos, images, and corporate sources such as documents and e-mail.
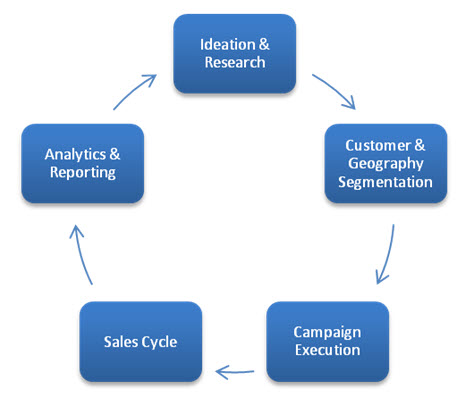
What has led to this chaos in the information industry? The short answer is the emergence of Web 2.0 business models. In a legacy sales and marketing cycle model, you would perform the following high-level activities:
In this model, there are a few notable areas where opportunity can be lost:
Ideation and Research
- Conducted without customer input. Data is gathered in surveys and studies, but the actual product developed is not completely aligned with customer expectations or requirements.
Customer and Geography Segmentation
- The consumer segmentation model is based on customer data gathered from transaction systems. Customer purchase behaviors are modeled in traditional market basket analysis (not with near-real-time data).
- Geography segmentation is based on ZIP code models and census data.
- Demographic segmentation across household and ZIP code is based on age and gender.
Campaign Execution
- Campaign execution occurs by sending e-mail, direct mail, and magazine coupons. Customers may or may not respond.
- Campaign response rate and success or failure is analyzed without customer sentiment analysis.
Competitive Intelligence
- Often relegated to research and sales departments.
- Purchased from third-party aggregators such as Nielsen or Acxiom. The data and associated metrics often reflect the market response prior to and during the time when demand arises for a product or service to its fulfillment, which is more akin to analytics with historical data inputs.
When you run business intelligence reports and analytics from this set of data, you can discover what happened and when it happened, but not why it happened, because this information is not clearly available as a statistic or metric. The biggest expectation from business intelligence has been to answer the question “why.” To do this, business analysts and subject matter experts sourced data from multiple systems inside and outside the organization, including the enterprise data warehouse and analytics platforms. Two issues came up: (1) traditional business intelligence had limited success because it couldn’t provide near-real-time insights or 360-degree views, and (2) data proliferated from the structured world to the unstructured world across the organization into spreadmarts and silos of solutions.
Web 2.0 changed things with Google, Amazon.com, blogs, forums, idea-sharingportals, and social media networks such as Facebook and Twitter. In a dramatic turn of events, customers discovered they could connect across geographies, demographics, and more by forming communities of interest. This led to viral sharing of information by consumers, in which one consumer could easily become a single influencer of a positive or negative sentiment about any organization, product, or service.
This behavior of a single consumer--or an entire crowd--fueled an explosion of data, and more important, connected the customer to the enterprise in two degrees of separation. Today, customers are involved in the process of idea generation and research (on sites such as www.ideastorm.com), campaigns (word-of-mouth marketing via Twitter and Facebook), and brand affinity and loyalty (Facebook and forums). The big challenge is understanding this new relationship with customers and learning how to leverage it.
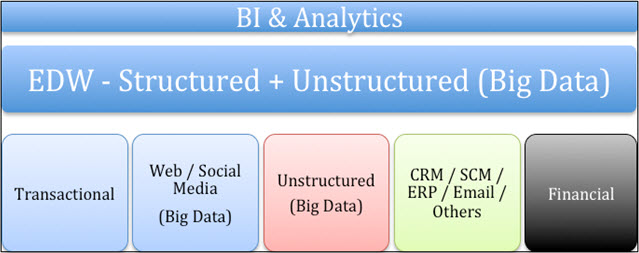
We must also draw our attention to the new data architecture, in which we integrate data from both inside and outside the organization. The vast amount of data available provides an opportunity to integrate summary data from current platforms; near-real-time customer data such as sentiments, competitive comparison, and market trends; and data from other decision-making systems, including content management, e-mail, and other enterprise platforms, as shown in the figure below.
With this extended data, we gain a clearer picture of not just what happened in the business cycle or when it happened, but more precisely why and how it happened. This set of metrics provides a robust capability to predict the future of your organization’s performance and its customer-centric models, the ability to connect with customers, and the power to stay ahead of the competition.
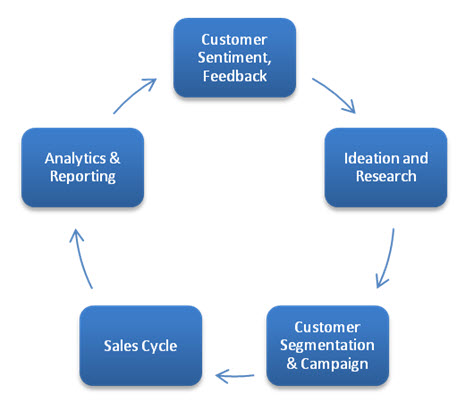
The new cycle of activities looks more like this:
The distinct feature here is the inclusion of customer sentiment and feedback in the sales and marketing cycle. This data is pivotal to the entire cycle. Take, for example, a classic customer relationship management system analyzing campaign performance. By adding customer inputs and candid feedback, you can analyze the success points of the campaign, the unmet expectations of a customer, and associated competitive feedback. An expanded perspective provides results that are far more insightful and meaningful. Another example is a simple Google search: by adding context to your search, the search engine returns results that are more valuable to the user.
The new business intelligence platform enables organizations to build and implement effective customer-centric models and strategies, thereby helping eliminate most of the opportunity costs and associated revenue leakages. Here are several types of metrics you can include with the new data set:
- Customer: Influencer ratio, amplification ratio, channel usage, sentiment
- Product: Sentiments, competitive ratio, strength ratio
- Campaign: Influence, response, sentiment
- Unstructured documents: Total documents, degree of relevance, location, type, owner
- E-mail: Sentiment, context
With an effective implementation strategy, your new BI solution will make the organization more competitive and innovative, thus fulfilling the promise of BI. There are a few Fortune 500 companies that have tasted success with this approach, and others are following in their footsteps.
Krish Krishnan is the president of Sixth Sense Advisors, Inc., a BI/DW consultancy based in Chicago, and a recognized expert in the strategy, architecture, and implementation of big data, data warehouse appliances, and high-performance data warehousing. He co-authored Building the Unstructured Data Warehouse with Bill Inmon.

Context-Enabled Business Intelligence
Troy Hiltbrand
To truly understand context and apply it in BI, it is vital to understand what context is and how it can address organizational needs. Context describes environmental factors that impact the way end users interact with a system. Context includes aspects of location, chronology, access method, demographics, social influence/relationships, end-user attitude/emotional state, behavior/past behavior, presence, and business environment.
Through the next decade, context will become a fundamental aspect of everything that we do--and business intelligence (BI) will be no exception. Context-enabled BI will take organizations to the next level by providing smarter and more valuable information to end users.
Read the article: Download Business Intelligence Journal, Vol. 17, No. 2


Highlight of key findings from TDWI's wide variety of research
The State of Next Generation Master Data Management
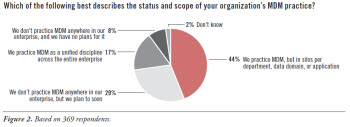
Discussions of MDM and related matters make one wonder whether organizations are actually practicing MDM. To quantify the situation, TDWI’s MDM survey asked: “Which of the following best describes the status and scope of your organization’s MDM practice?” (See Figure 2.)
MDM solutions are fairly common today. The majority of surveyed organizations (61%) practice some form of MDM today, regardless of the method, tool type, or generational phase. Although this presence is respectable for MDM, it’s rather modest given that MDM has been a hot topic in the IT press for 15 years and that users are famous for exploring its potential use.
Many organizations would like to practice MDM but haven’t yet (29%). This report’s survey aside, other TDWI surveys have consistently shown a substantial percentage of user organizations stuck in an MDM exploration phase (42% on average; not charted here). Many users see the value of MDM but still can’t attain organizational commitment. As we’ll see later, the first generation of an MDM program can be stymied by a lack of sponsorship, business case, governance, cross-functional cooperation, MDM expertise, and so on. With so much stacked against it, the first generation of MDM is probably the most critical; without it other generations are not possible.
Read the full report: Download Next Generation Master Data Management (TDWI Best Practices Report, Q2 2012)


FlashPoint Rx prescribes a "Mistake to Avoid" for business intelligence and data warehousing professionals.
Mistake: Assuming Technical Maturity
Marc Demarest
Much of the technology we’re asked to contemplate when building big data environments is staggeringly immature. It’s so immature that we cannot assume the features we expect in any competent technology are contained in some of the most popular big data components. Single points of failure abound, configuration of a complex environment is often performed by copying XML files around a large grid of service nodes, and things we might consider price-to-play items are not possible or are difficult at best. Functionality we assume to be present is not, is rudimentary, or requires coding.
Our dependency on traditional, reliable suppliers (see Mistake Nine) has raised the level of service we expect from the data management infrastructure, and we don’t ask questions we should because, after all, what self-respecting DBMS vendor would sell a product with no bulk-export feature?
I have seen more than a few prototype big data environments where the team’s time is spent hacking and whacking at purchased or open source technologies to ensure they operate in ways that are consistent with organizational practices, expectations, and requirements. There’s no commercial value there; that’s unplanned integration cost, pure and simple. And that unplanned integration cost is, in turn, the result of incomplete planning (see Mistake Four).
Smart big data strategists aren’t making large-scale commitments to big data technologies that haven’t been sandboxed and tested, end-to-end, for the long list of don’t-haves and gotchas that (for the next few years at least) will characterize many big data technologies and will have to be costed out, scheduled, and implemented as part of a well-planned and well-executed project.
Read the full issue: Download Ten Mistakes to Avoid in Big Data (Q2 2012)
