 View online: tdwi.org/flashpoint


June 7, 2012
ANNOUNCEMENTS
New TDWI Checklist Report: Strategic Planning for Big Data Management
CONTENTS

TDWI Salary Survey: Wages, Bonuses on the Rise
Making a Case for Patient Engagement

Democratic Analytics: A Campaign to Bring Business Intelligence to the People

Benefits and Implementation Drivers

Mistake: Ignoring Other Initiatives

See what's
current in TDWI Education, Events, Webinars,
and Marketplace
TDWI Salary Survey:
Wages, Bonuses on the Rise
Mark Hammond
TDWI Contributing Analyst
Topic:
BI/DW Salaries
With organizations increasing investments in data management and analysis in the era of big data, it’s a lucrative time to work in the BI/DW industry.
Average salaries for BI/DW professionals rose 2.7 percent in 2011 to an average of $106,095 across 19 roles, according to the popular 2012 TDWI Salary, Roles, and Responsibilities Report, published in March. Viewed as a median, salaries rose 3.5 percent to $102,000 in 2011.
Meanwhile, the survey found a stunning 51 percent increase in average bonuses, from a record low of $10,866 in 2010 to a record high of $16,444 in 2011. This reverses three consecutive years of recession-related bonus declines; the median bonus increased as well, up 19 percent to $9,500. The percentage of BI/DW professionals receiving bonuses grew from 58 percent to 64 percent.
Now in its ninth year, the TDWI salary report provides a comprehensive, data-based guide valuable to both employees and managers to compare compensation at their organizations. Based on a survey of 1,210 BI/DW professionals, the 2012 report breaks down compensation by key role, industry, organizational BI/DW maturity, practitioner experience, age, gender, geographic region, certification, and other attributes.
The survey has traditionally found, for instance, that professional certification pays off in higher wages. In 2011, BI/DW practitioners with three certifications averaged $115,466 in wages--14 percent more than those with one certification. Other highlights include:
- Gender. Women are compensated less than men by a substantial degree. The gender gap widened in the 2012 study to a 15.3 percent margin, with women averaging $95,390 versus $110,010 for men. Twenty-seven percent of our respondents were female.
- Industry. Media and entertainment is the most lucrative industry for BI/DW, with average salaries of $116,363 in 2011. Consulting and professional services was second, at $115,237. State and local government, as well as education, ranked lowest at $89,201 and $85,113, respectively.
- Role. The role of BI director commands the highest average salary, at $132,317. Factor in an average bonus of $17,021 (received by 79 percent of BI directors) and compensation for this role is nearly $150,000. Coming in last, business requirements analysts make $88,419 in salary.
- Job satisfaction. After hitting a record low in 2010, job satisfaction rebounded to 50 percent of respondents characterizing their satisfaction as “high” or “very high” versus 11 percent as “low” or “very low.” Forty-five percent feel they are fairly compensated, 35 percent think they are paid too little, and 19 percent are unsure.
- BI maturity. Organizations with “advanced” BI environments pay 9 percent more than “beginner” organizations--$109,646 versus $100,198.
- Years of experience. Unsurprisingly, experience translates to higher wages--$118,512 for BI practitioners with 10 or more years of experience versus $83,941 for those in their first year.
The salary report also takes an in-depth look at 10 key roles, with breakdowns of salaries and bonuses, average age and years of experience, certifications, professional background, and more. It also benchmarks BI maturity, with 38 percent calling their BI environments “advanced,” 45 percent “intermediate,” and 17 percent “beginner.”
Given that the majority of organizations are still on the road to BI maturity and need skilled resources to handle increases in data volume, variety, and velocity, we can expect fairly strong increases in BI/DW compensation for the foreseeable future.
Download a copy of the 2012 TDWI Salary, Roles, and Responsibilities Report. This report is exclusively available to TDWI Premium Members.
Mark Hammond is a veteran contributor to TDWI, including a number of research reports, Business Intelligence Journal, What Works, and more.

Making a Case for Patient Engagement
Mohan Srireddy
DecisionPath Consulting
Topic:
Business Intelligence
With recent healthcare legislation, we’ve seen increased interest for better use of medical information. One common challenge for healthcare providers is knowing where to start. Medical devices generate a lot of data, some of which is captured in patient records management systems. The rest may be stored in harder-to-access locations or may be lost. There’s a strong desire to coordinate care across providers, Medicaid, and insurers to reduce the overall cost of treatment, which requires free movement of data and systems that can digest large volumes of data and identify emerging trends. Business intelligence (BI) systems provide the foundation and framework for bringing together this disparate data, and present it in an easy-to-use fashion.
In this article, I focus on just one of the areas drawing attention in the healthcare community: patient engagement. Patient engagement refers to the shared responsibility between patients, healthcare practitioners, and healthcare administrators to co-develop pathways to optimal individual, community, and population health. Studies show that patient engagement leads to better health outcomes. People with complex health needs who are engaged in their care (e.g., self-managing a health condition or participating in treatment decisions) have better quality and experience of care.
Patient Engagement: A Two-Way Street
Patient engagement needs to go beyond sharing data with patients. BI systems convert data into actionable information. Businesses in other industries have used performance metrics for a long time to help motivate and encourage desired behaviors among employees and customers. Similarly, a BI environment can provide scorecards to promote desired behaviors among patients. Alerts can be used in conjunction with metrics such as weight, blood pressure, and diabetes-related measures to help patients adjust their actions and control their health. The BI environment can bring information from different sources, such as nutrition plans, home-monitoring data (e.g., weight, blood pressure, insulin levels), and current prescription information, and combine it with information from health exchanges to provide a holistic view to the care provider.
Accessibility of patient data is a start, but patient engagement can be more than just a one-way flow of information. It is an opportunity to open and maintain communication channels through new technology while not taxing the care provider. An engaged patient is more likely to actively manage his or her health and focus on preventive care versus treatment as an illness progresses. The care provider can be presented with an overview of patients’ health records with exceptions highlighted. Imagine a group of patients at high risk for cardiac problems who are under the care of a cardiologist. If the care provider had more frequent access to the test results of patients’ risk factors (e.g., blood pressure, weight, smoking, alcohol consumption, cholesterol level) than the usual biannual checkup, and if the information highlighted which patients were out of normal ranges, the care provider could be more active in monitoring those patients or offering counseling to change risky behaviors. Plus, the patients could see how they are progressing in their care and management compared to other patients in a similar risk group.
Simply implementing a patient engagement system is not a solution. Many technology projects fail because they don’t properly engage the user community, and don’t first change internal processes and culture. All BI system implementations need a change management initiative to bring about the necessary cultural change. The same best practices that apply to corporate BI projects also apply to implementing a successful patient engagement program. It’s important to develop a road map and implement change initiatives in small increments and iterate frequently.
Assessing the System: Measuring More than the Patient
Once a patient engagement system is in place, it is important to measure and track both immediate and long-term engagement metrics, such as:
- Immediate metrics that show greater engagement:
- Duration of visit
- Frequency of visit
- Percentage of repeat visits
- Date of most recent visit
- Long-term metrics that show improvement in quality of care:
- Beneficial trends in patient health indicators
- Number of hospital admissions per patient
- Number of minor vs. major illnesses per patient
BI creates a foundation for the easy exchange of information. Once a foundation is in place with the right architecture, a multitude of benefits can be derived. BI can help with the management and insight of provider productivity, care costs, and payment reimbursement imbalances, and give providers better data access when negotiating with private insurance companies. It can also be the foundation for supporting analytics for evidence-based care. Patient engagement can be a differentiator for the provider and the catalyst to bring changes that more actively engage patients in all aspects of their care.
Mohan Srireddy is a principal consultant at DecisionPath Consulting. Mohan has over 16 years of experience in both traditional IT and business intelligence roles. He has helped organizations in healthcare, insurance, real estate, defense, distribution, and retail industries start, evaluate, and expand their BI/DW initiatives.


Democratic Analytics: A Campaign to Bring Business Intelligence to the People
Nigel Stoodley
Getting
people to interact with business intelligence (BI) data directly and
create their own customized reports builds a more collaborative
workplace. Easy-to-use analytics software can be the basis for this
powerful, collaborative enterprise. Instead of isolating analytics
inside IT departments, BI should be pushed into all business units in an
organization where competitive advantages may be achieved by having
business analysts and decision makers work together to uncover hidden
value with data analysis.
This article shows how two organizations--the cities of Charlotte and
Pittsburgh--have succeeded in putting BI into users’ hands, including
decision makers and business analysts. It also describes how
collaborative efforts led to more streamlined public services,
impressive cost-cutting efforts, and vastly improved communication
between citizens and their smarter local governments.
Read the article: Download Business Intelligence Journal, Vol. 17, No. 1

Highlight of key findings from TDWI's wide variety of research
Benefits and Implementation Drivers
The limitations on BI and analytics for mobile platforms should not overshadow the potential benefits opened up by the new form factor. The ultimate role of mobile BI may not be to simply replicate what’s been done on desktops and workstations or to merely act as clients in existing architectures. Mobile devices facilitate information on the go and the application of information insights to dynamic situations with colleagues, business partners, and customers. Strategies and expectations should be different.
BI and analytics applications are arriving on devices that already have a role in users’ lives, primarily for communication and collaboration. Organizations can use the mobility, geolocation, and interface features that are unique to these devices to their advantage. The devices can deliver information in the context of ongoing collaboration with colleagues, partners, and customers, enabling users to illustrate points with data and use information more effectively for shared decisions. As forms, documents, and other content move off paper and become digital, users will want to implement BI reports and data access functions to develop integrated views of all information. These views can bring together information that is important for reducing delays and streamlining business processes.
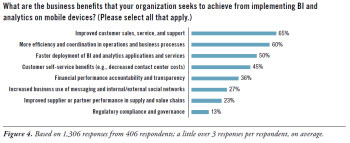
Our research identified some key business benefits that organizations seek to achieve from implementing BI and analytics on mobile devices (see Figure 4).
(Click for larger image)
Read the full report: Download Mobile Business Intelligence and Analytics: Extending Insight to a Mobile Workforce (TDWI Best Practices Report, Q1 2012)

FlashPoint Rx prescribes a "Mistake to Avoid" for business intelligence and data warehousing professionals.
Mistake: Ignoring Other Initiatives
Jonathan G. Geiger
The BI/DW environment does not exist by itself. It’s part of a greater ecosystem that includes many systems and data stores, and at any point in time there are several projects (e.g., ERP or MDM) planned and under way, including some related to the data warehouse. Often, some of these other projects entail system replacements or upgrades, and the affected systems are ones that interact with the data warehouse. The BI/DW evaluation needs to consider these changes to the environment because inputs to the data warehouse may change.
There are other factors to keep in mind. The migration to a replacement system, for example, includes a data conversion as well as outputs in the form of interfaces to other systems and reports. A complete validation of your BI/DW direction needs to include an understanding of the systems development plans and consideration of capabilities that could be better served with the BI/DW environment. In the cited example, the historical data from the old system may not be needed for operational purposes. Offloading that data into the data warehouse makes it available for query, reporting, and analytics while simultaneously reducing the data volume within the operational environment.
By including an understanding of the systems development plans when validating your BI/DW direction, you gain a more holistic perspective, and you can place capabilities within the application best suited to providing them.
Read the full issue: Download Ten Mistakes to Avoid When Validating Your BI/DW Direction (Q1 2012)

