Pentaho Adds Interactive Visualization, Expands Big Data Analytics in Business
Pentaho Business Analytics 4.5 platform unifies data integration, business analytics to accelerate business insights.
Note: TDWI’s editors carefully choose vendor-issued press releases about new or upgraded products and services. We have edited and/or condensed this release to highlight key features but make no claims as to the accuracy of the vendor's statements.
Pentaho Corporation has released Pentaho Business Analytics 4.5, featuring new user-driven, interactive visualization and data exploration capabilities that access all data sources, including big data. The release also includes a pluggable and extensible interface for software and SaaS companies to easily add third-party visualizations.
Pentaho offers a unified data integration and business analytics platform that both IT and line-of-business users can employ to quickly and easily collaborate and iterate to achieve better analysis and make better business decisions.
Pentaho Business Analytics 4.5 includes location-based data visualization and enhanced analytics capabilities for business users, such as:
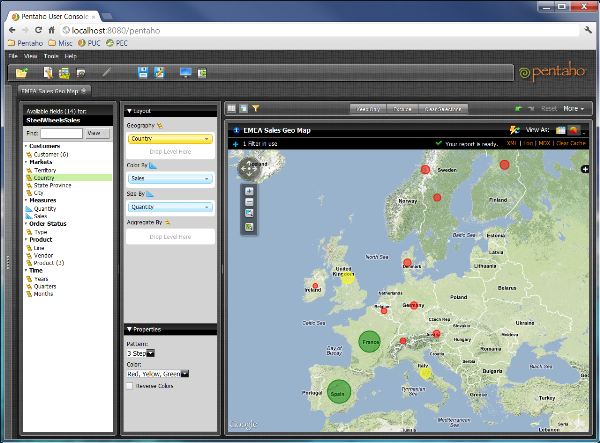
- Geo mapping (see figure below), heat grids, scatter/bubble chart visualizations
- Interactive visual analysis such as lasso filtering, zoom, and attribute highlighting on all chart types
- Interactive reporting enhancements designed for non-technical users
- In-memory cache performance improvements
Expanded Insight into Big and Diverse Data
Pentaho has also expanded its ability to access, integrate, visualize, and analyze all data sources, including big data, with the following new features:
- Simplified deployment options for efficient distribution across Hadoop clusters, including a new Debian RPM for MapR and support for Hadoop’s distributed cache
- Expanded NoSQL database integration including read, write, and reporting with Apache Cassandra, DataStax and MongoDB
- Performance and ease-of-use improvements in the Pentaho MapReduce visual designer - Support for secure Hadoop clusters
- Availability of an extensive online, distribution-specific “how to” resource center, community.pentaho.com/BigData
Version 4.5 makes it easier to embed and customize within OEM and enterprise applications Pentaho Business Analytics’ pluggable, extensible interface for software and SaaS has been enhanced with new features to support a pluggable visualization framework that allows the addition of custom or third-party visualizations. The update can now helps users tailor report viewing with scriptable data source logic and custom report parameter prompts
More information is available at www.pentaho.com.